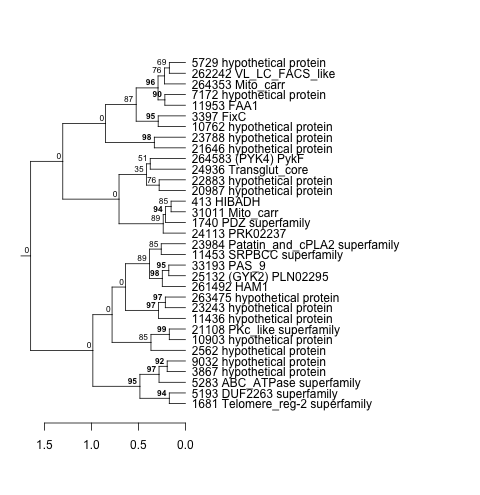
Hierarchical Clusters
Displaying 401 - 500 of 7500
| Title | Cluster Plot | Dendrogram | e-value | e-value | e-value | Condition | Condition FDR | Condition Difference |
|---|---|---|---|---|---|---|---|---|
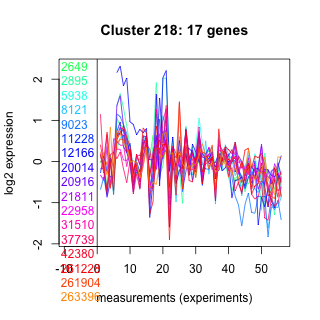
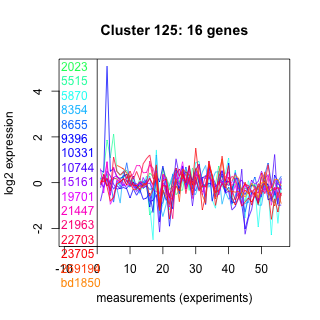
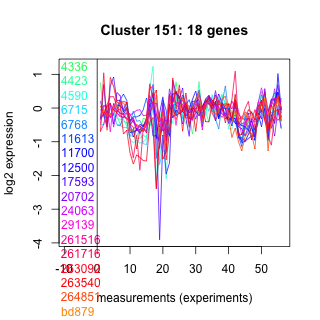
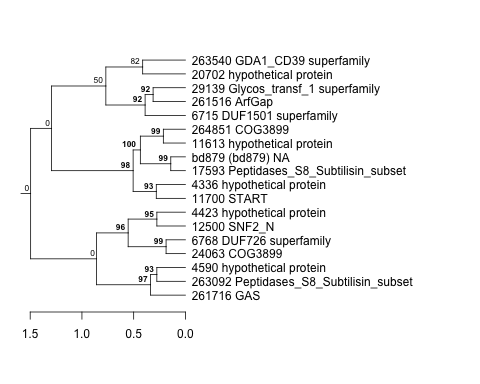
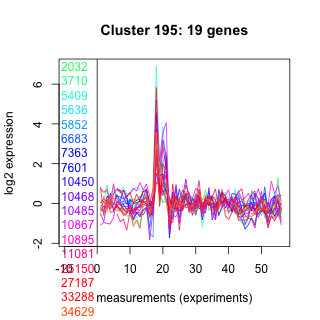
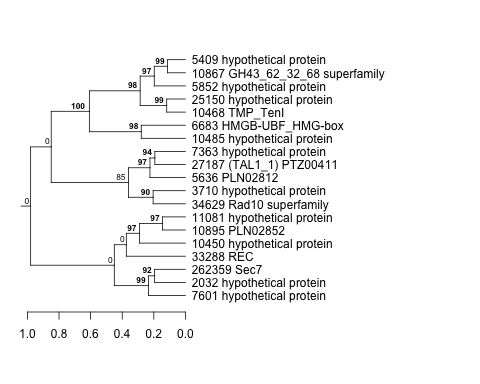
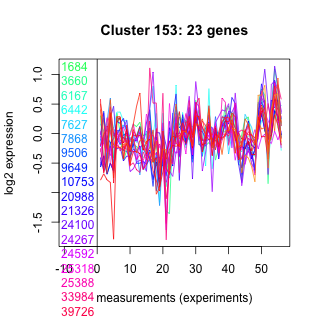
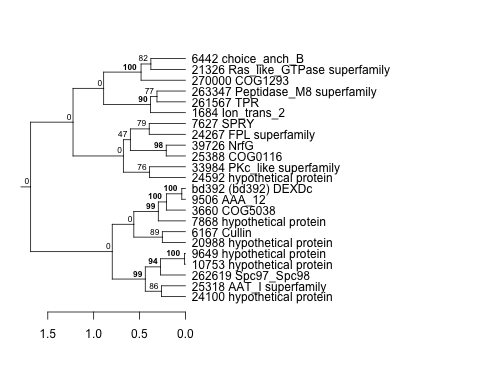
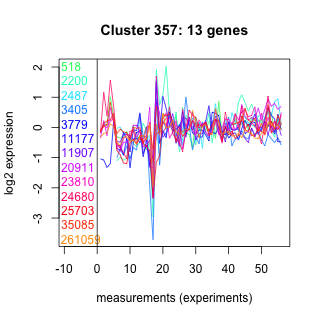
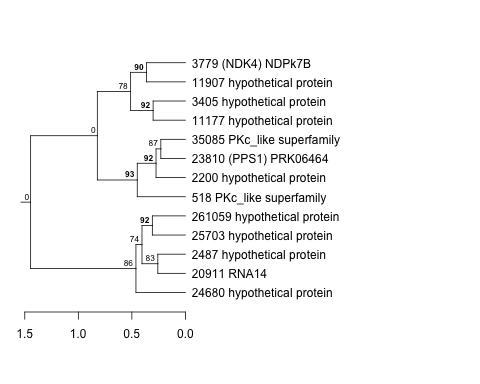
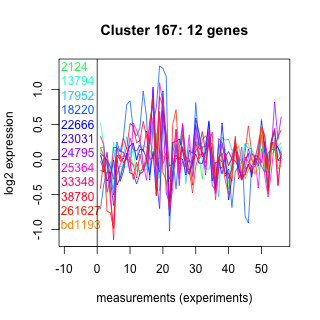
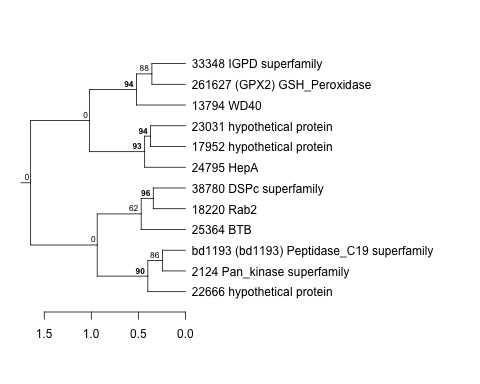
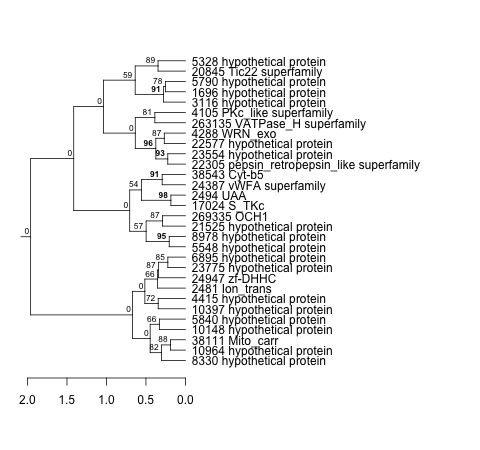
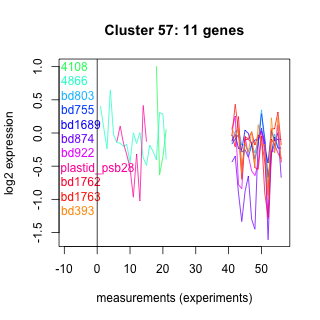
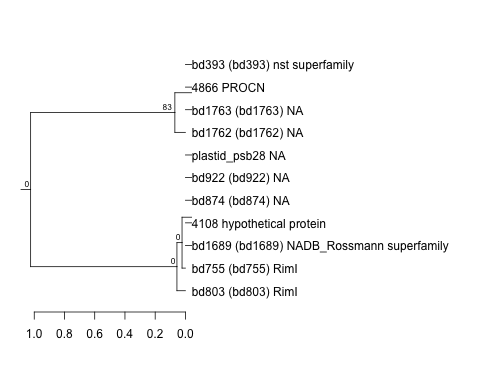
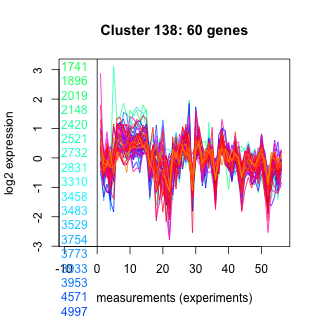
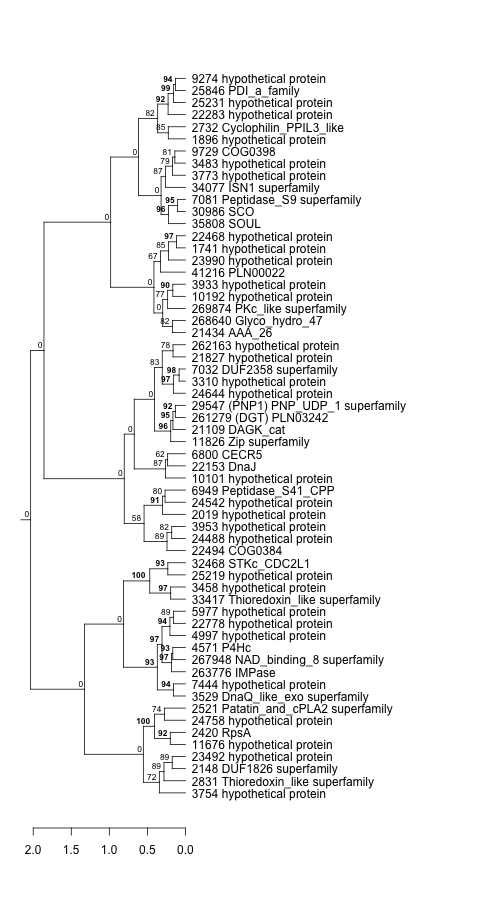
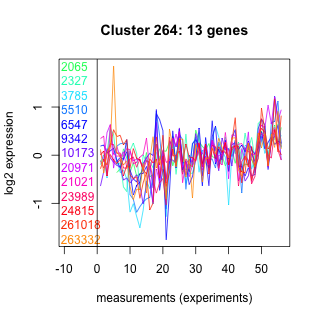
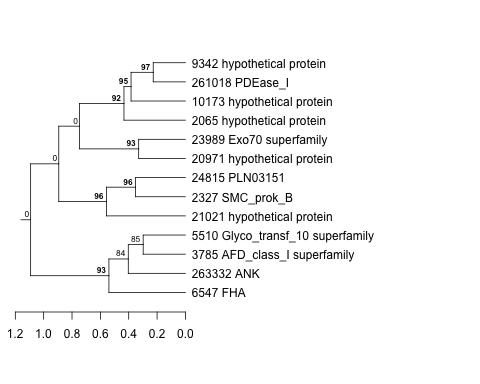
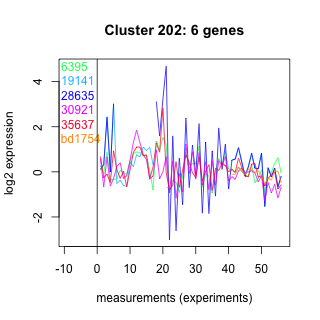
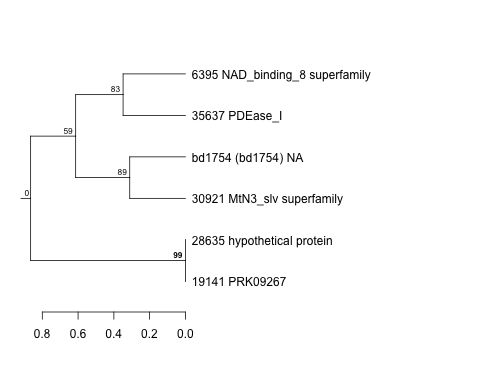
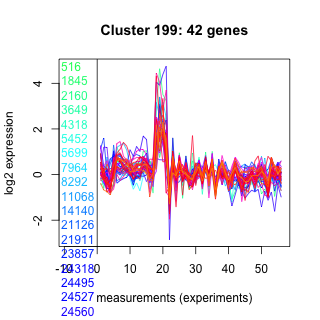
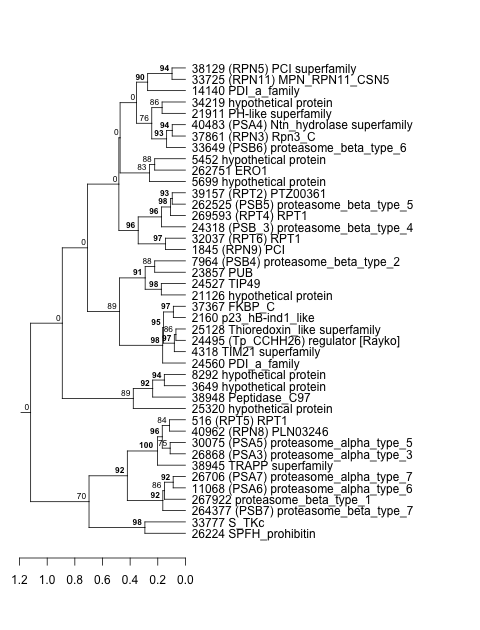
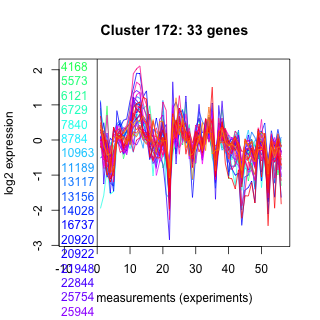
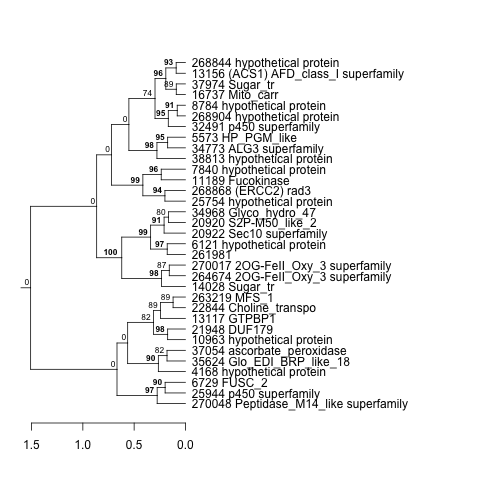
| Thaps_hclust_0218 |
 |
 |
0.02 |
0.065 |
7.1 |
lowSi_TMEVA | 0.976000 | -0.131 |
| Title | Cluster Plot | Dendrogram | e-value | e-value | e-value | Condition | Condition FDR | Condition Difference |
|---|---|---|---|---|---|---|---|---|
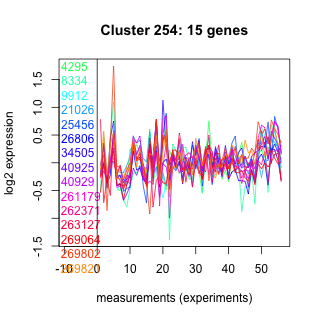
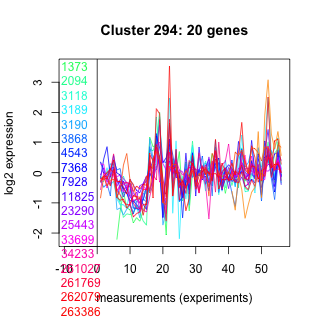
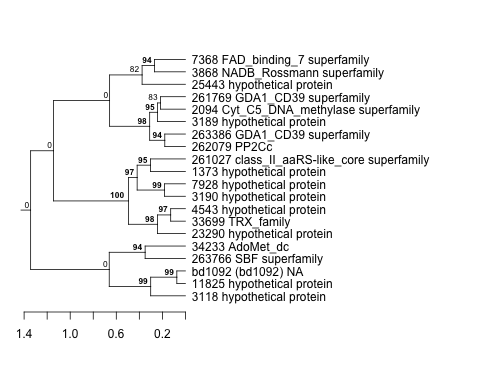
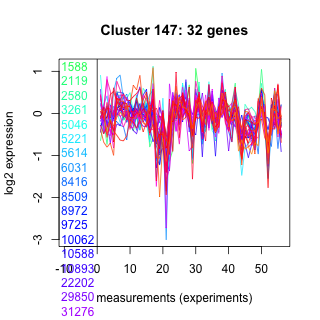
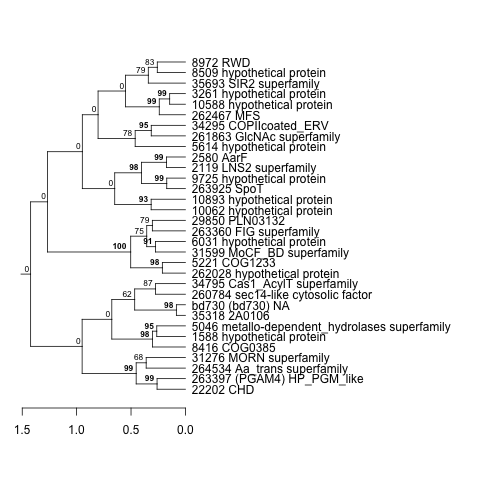
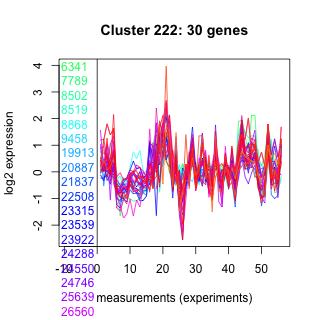
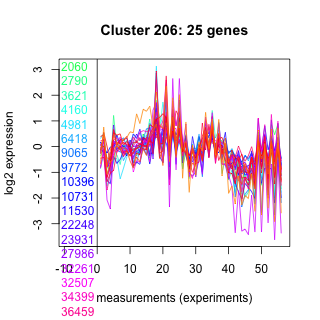
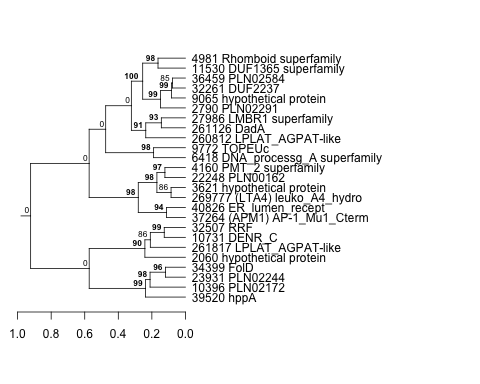
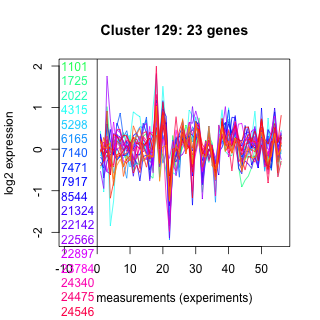
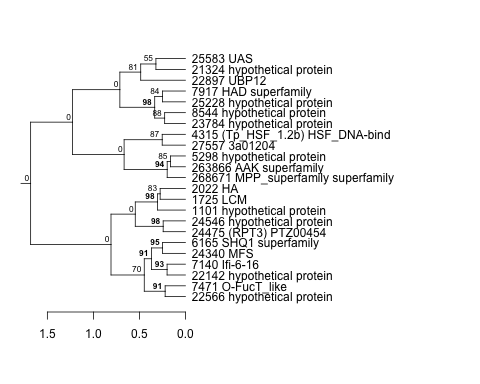
| Thaps_hclust_0254 |
 |
 |
0.00045 |
0.0045 |
5.8 |
diel_exponential_vs_stationary | 0.976000 | -0.00879 |
| Thaps_hclust_0254 |
|
|
0.00045 |
0.0045 |
5.8 |
co2_elevated_expo_arrays | 0.971000 | -0.0221 |
| Title | Cluster Plot | Dendrogram | e-value | e-value | e-value | Condition | Condition FDR | Condition Difference |
|---|---|---|---|---|---|---|---|---|
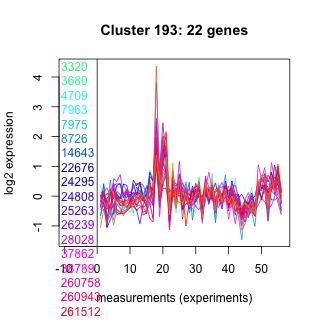
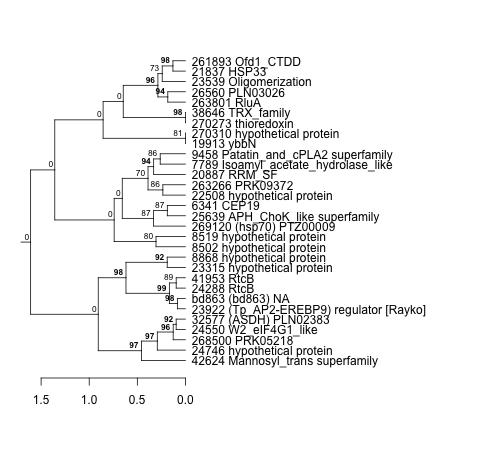
| Thaps_hclust_0193 |
 |
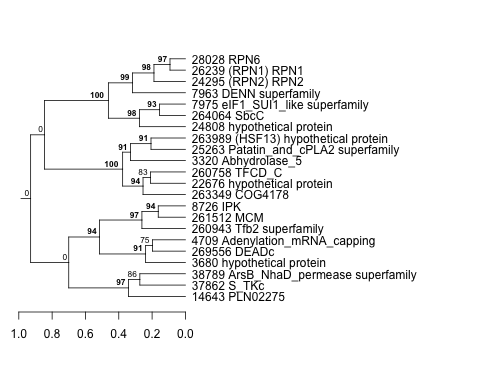 |
0.00027 |
0.013 |
6.2 |
co2_elevated_expo_arrays | 0.976000 | 0.02 |
| Thaps_hclust_0193 |
|
|
0.00027 |
0.013 |
6.2 |
lowSi_TMEVA | 0.976000 | -0.121 |
| Title | Cluster Plot | Dendrogram | e-value | e-value | e-value | Condition | Condition FDR | Condition Difference |
|---|---|---|---|---|---|---|---|---|
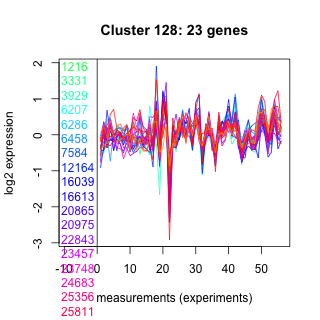
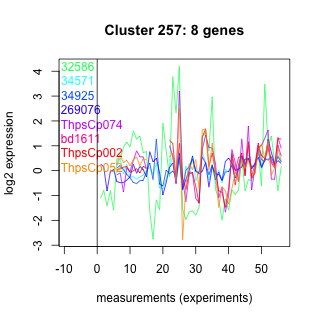
| Thaps_hclust_0128 |
 |
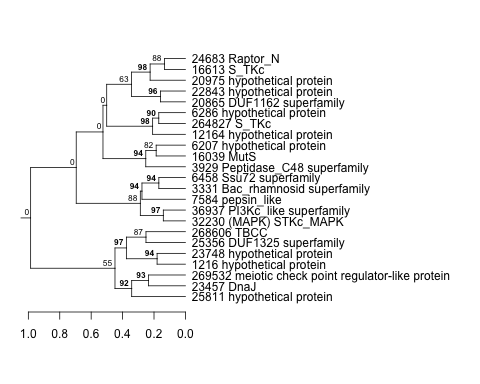 |
0.0000000058 |
0.00033 |
21 |
lowSi_TMEVA | 0.976000 | 0.122 |
| Title | Cluster Plot | Dendrogram | e-value | e-value | e-value | Condition | Condition FDR | Condition Difference |
|---|---|---|---|---|---|---|---|---|
| Thaps_hclust_0217 |
 |
 |
0.00000028 |
0.95 |
9.7 |
lowSi_TMEVA | 0.976000 | -0.14 |
| Title | Cluster Plot | Dendrogram | e-value | e-value | e-value | Condition | Condition FDR | Condition Difference |
|---|---|---|---|---|---|---|---|---|
| Thaps_hclust_0091 |
 |
 |
0.00000061 |
0.00022 |
0.44 |
lowSi_TMEVA | 0.976000 | -0.124 |
| Title | Cluster Plot | Dendrogram | e-value | e-value | e-value | Condition | Condition FDR | Condition Difference |
|---|---|---|---|---|---|---|---|---|
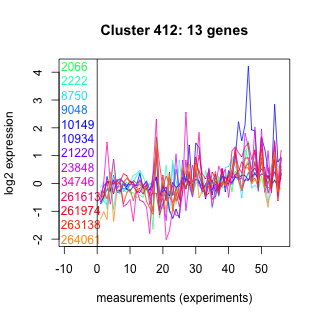
| Thaps_hclust_0412 |
 |
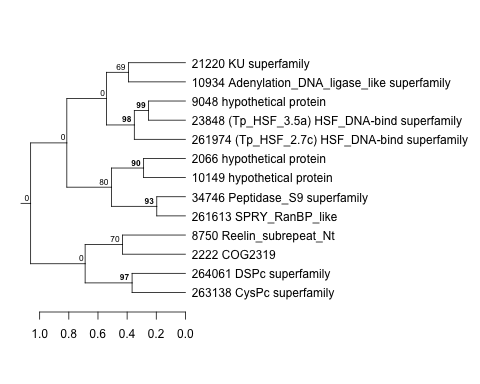 |
0.39 |
17 |
2.9 |
lowSi_TMEVA | 0.976000 | -0.118 |
| Title | Cluster Plot | Dendrogram | e-value | e-value | e-value | Condition | Condition FDR | Condition Difference |
|---|---|---|---|---|---|---|---|---|
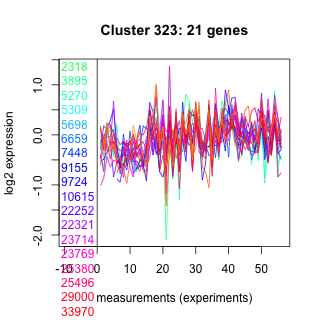
| Thaps_hclust_0323 |
 |
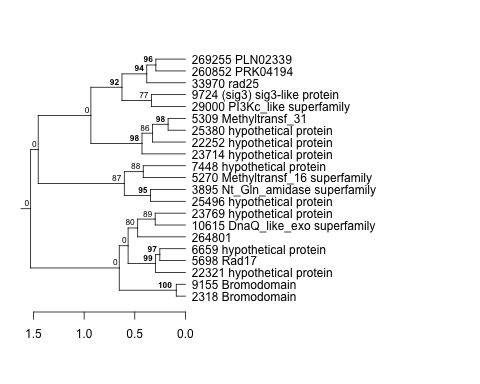 |
0.0011 |
0.014 |
36 |
lowSi_TMEVA | 0.976000 | -0.134 |
| Title | Cluster Plot | Dendrogram | e-value | e-value | e-value | Condition | Condition FDR | Condition Difference |
|---|---|---|---|---|---|---|---|---|
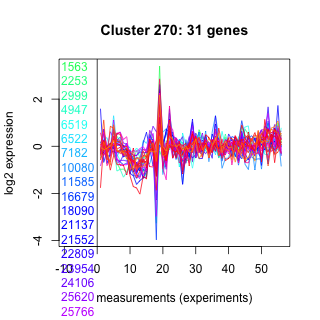
| Thaps_hclust_0270 |
 |
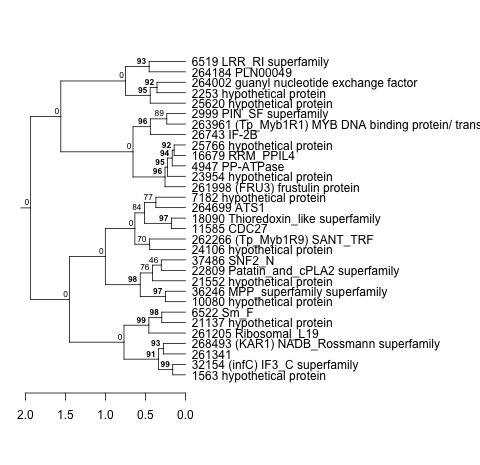 |
0.0000000000069 |
0.000026 |
0.0036 |
lowSi_TMEVA | 0.976000 | -0.139 |
| Thaps_hclust_0270 |
|
|
0.0000000000069 |
0.000026 |
0.0036 |
lowFe_KTKB_Day5 | 0.968000 | 0.00729 |
| Title | Cluster Plot | Dendrogram | e-value | e-value | e-value | Condition | Condition FDR | Condition Difference |
|---|---|---|---|---|---|---|---|---|
| Thaps_hclust_0288 |
 |
 |
0.032 |
0.0067 |
0.047 |
lowSi_TMEVA | 0.976000 | -0.134 |
| Title | Cluster Plot | Dendrogram | e-value | e-value | e-value | Condition | Condition FDR | Condition Difference |
|---|---|---|---|---|---|---|---|---|
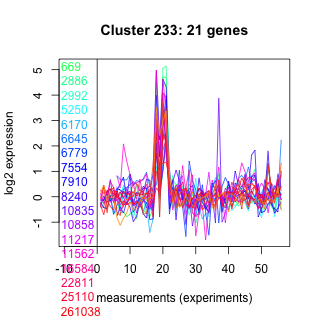
| Thaps_hclust_0233 |
 |
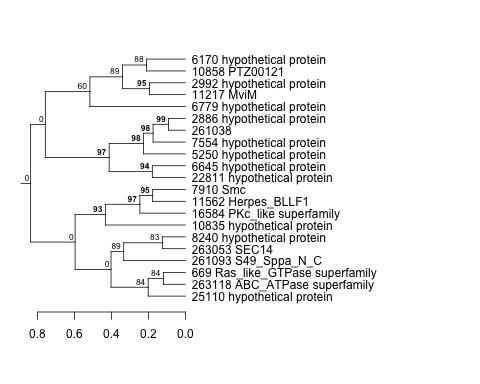 |
0.01 |
0.026 |
25 |
lowSi_TMEVA | 0.976000 | 0.12 |
| Thaps_hclust_0233 |
|
|
0.01 |
0.026 |
25 |
exponential_vs_stationary_24highlight | 0.967000 | -0.00673 |
| Title | Cluster Plot | Dendrogram | e-value | e-value | e-value | Condition | Condition FDR | Condition Difference |
|---|---|---|---|---|---|---|---|---|
| Thaps_hclust_0125 |
 |
 |
0.1 |
0.35 |
2.4 |
lowSi_TMEVA | 0.976000 | -0.122 |
| Title | Cluster Plot | Dendrogram | e-value | e-value | e-value | Condition | Condition FDR | Condition Difference |
|---|---|---|---|---|---|---|---|---|
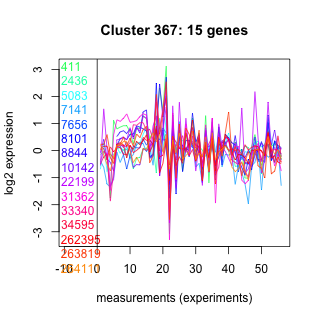
| Thaps_hclust_0367 |
 |
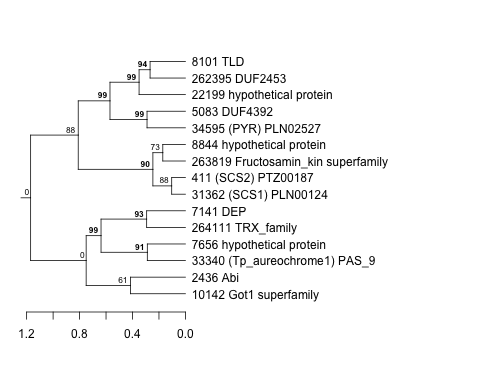 |
0.027 |
0.079 |
0.86 |
co2_elevated_expo_arrays | 0.976000 | 0.0201 |
| Title | Cluster Plot | Dendrogram | e-value | e-value | e-value | Condition | Condition FDR | Condition Difference |
|---|---|---|---|---|---|---|---|---|
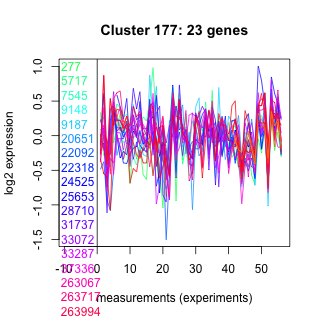
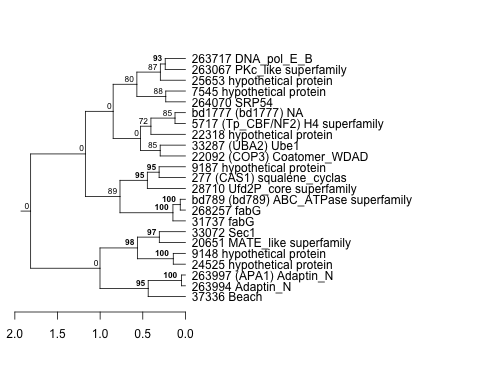
| Thaps_hclust_0177 |
 |
 |
0.0000000012 |
0.0000078 |
0.00084 |
lowSi_TMEVA | 0.976000 | -0.127 |
| Title | Cluster Plot | Dendrogram | e-value | e-value | e-value | Condition | Condition FDR | Condition Difference |
|---|---|---|---|---|---|---|---|---|
| Thaps_hclust_0338 |
 |
 |
0.0000012 |
0.0000014 |
0.000012 |
lowSi_TMEVA | 0.976000 | -0.131 |
| Title | Cluster Plot | Dendrogram | e-value | e-value | e-value | Condition | Condition FDR | Condition Difference |
|---|---|---|---|---|---|---|---|---|
| Thaps_hclust_0074 |
 |
 |
77 |
130 |
300 |
lowFe_KTKB_Day3 | 0.975000 | 0.0129 |
| Title | Cluster Plot | Dendrogram | e-value | e-value | e-value | Condition | Condition FDR | Condition Difference |
|---|---|---|---|---|---|---|---|---|
| Thaps_hclust_0396 |
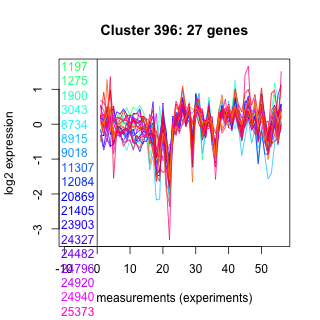 |
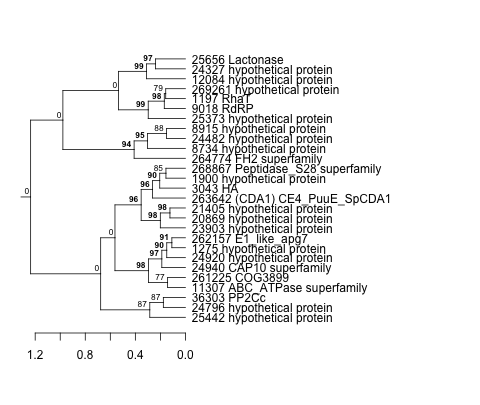 |
0.082 |
10 |
29 |
lowFe_TMEVA | 0.975000 | 0.0177 |
| Thaps_hclust_0396 |
|
|
0.082 |
10 |
29 |
co2_elevated_expo_arrays | 0.971000 | -0.0217 |
| Thaps_hclust_0396 |
|
|
0.082 |
10 |
29 |
diel_light_vs_dark | 0.970000 | -0.0113 |
| Title | Cluster Plot | Dendrogram | e-value | e-value | e-value | Condition | Condition FDR | Condition Difference |
|---|---|---|---|---|---|---|---|---|
| Thaps_hclust_0179 |
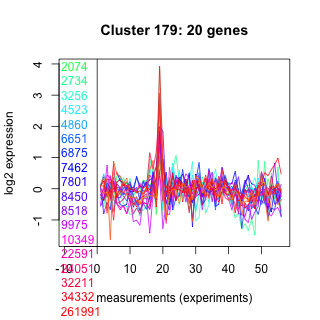 |
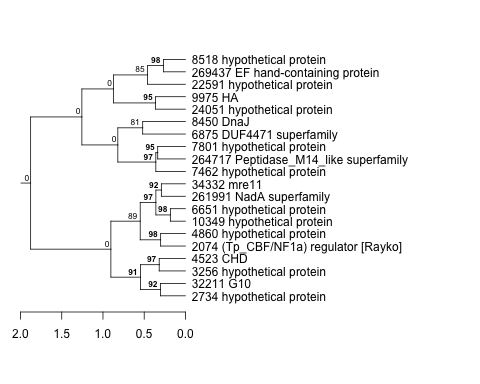 |
0.0000039 |
0.056 |
2.8 |
lowtemp_TMEVA | 0.975000 | -0.0115 |
| Thaps_hclust_0179 |
|
|
0.0000039 |
0.056 |
2.8 |
lowSi_TMEVA | 0.974000 | -0.146 |
| Thaps_hclust_0179 |
|
|
0.0000039 |
0.056 |
2.8 |
lowFe_KTKB_Day3 | 0.968000 | -0.0132 |
| Thaps_hclust_0179 |
|
|
0.0000039 |
0.056 |
2.8 |
co2_elevated_expo_arrays | 0.968000 | 0.0264 |
| Title | Cluster Plot | Dendrogram | e-value | e-value | e-value | Condition | Condition FDR | Condition Difference |
|---|---|---|---|---|---|---|---|---|
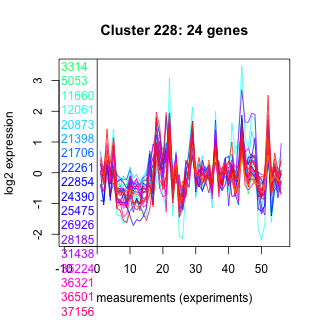
| Thaps_hclust_0228 |
 |
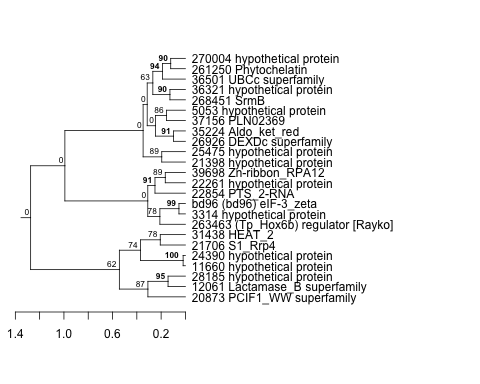 |
0.00000000000028 |
0.0027 |
0.016 |
lowFe_KTKB_Day3 | 0.975000 | 0.00784 |
| Title | Cluster Plot | Dendrogram | e-value | e-value | e-value | Condition | Condition FDR | Condition Difference |
|---|---|---|---|---|---|---|---|---|
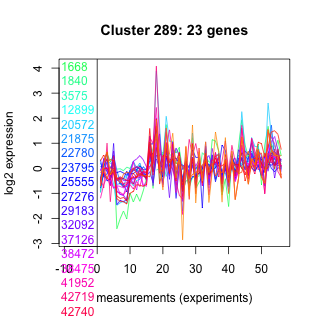
| Thaps_hclust_0289 |
 |
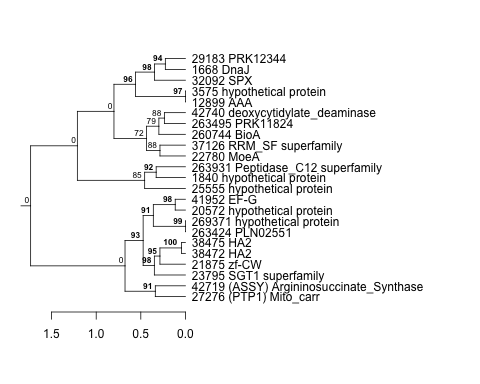 |
0.0000000000026 |
0.00000000000025 |
0.0000045 |
lowFe_TMEVA | 0.975000 | 0.0179 |
| Title | Cluster Plot | Dendrogram | e-value | e-value | e-value | Condition | Condition FDR | Condition Difference |
|---|---|---|---|---|---|---|---|---|
| Thaps_hclust_0395 |
 |
 |
0.0015 |
0.0018 |
0.48 |
lowFe_TMEVA | 0.975000 | -0.0182 |
| Title | Cluster Plot | Dendrogram | e-value | e-value | e-value | Condition | Condition FDR | Condition Difference |
|---|---|---|---|---|---|---|---|---|
| Thaps_hclust_0430 |
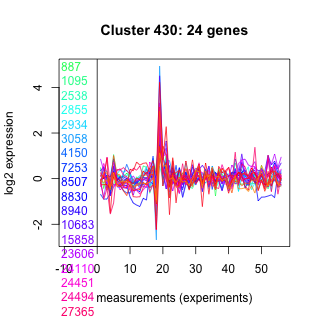 |
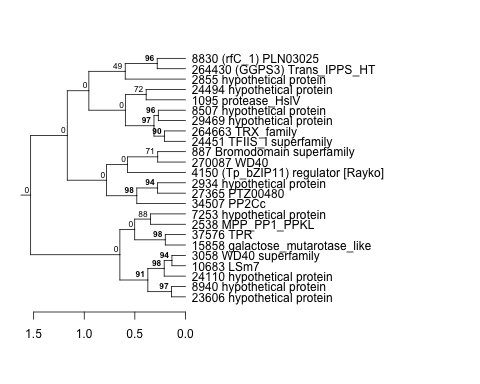 |
0.0000088 |
0.0043 |
0.22 |
lowFe_TMEVA | 0.975000 | -0.0192 |
| Thaps_hclust_0430 |
|
|
0.0000088 |
0.0043 |
0.22 |
co2_elevated_expo_arrays | 0.971000 | 0.0223 |
| Title | Cluster Plot | Dendrogram | e-value | e-value | e-value | Condition | Condition FDR | Condition Difference |
|---|---|---|---|---|---|---|---|---|
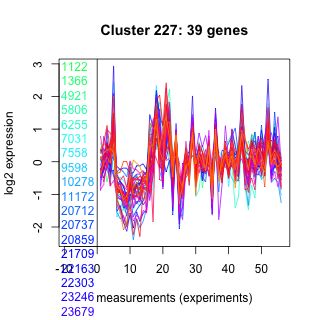
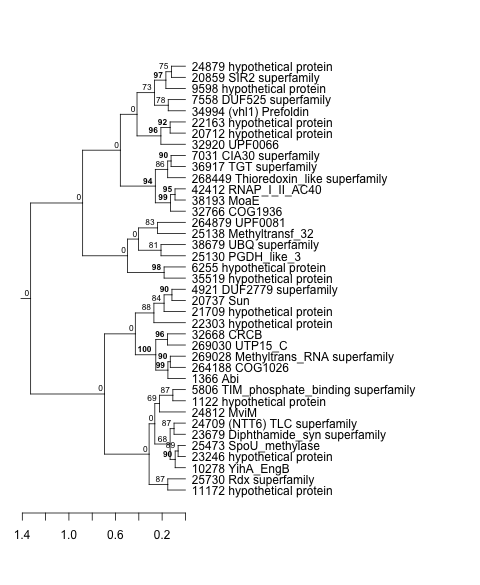
| Thaps_hclust_0227 |
 |
 |
1.2e-22 |
0.0000000098 |
0.0018 |
lowFe_TMEVA | 0.975000 | 0.0176 |
| Thaps_hclust_0227 |
|
|
1.2e-22 |
0.0000000098 |
0.0018 |
exponential_vs_stationary_24highlight | 0.970000 | 0.00406 |
| Title | Cluster Plot | Dendrogram | e-value | e-value | e-value | Condition | Condition FDR | Condition Difference |
|---|---|---|---|---|---|---|---|---|
| Thaps_hclust_0084 |
 |
 |
0.0000000000035 |
0.00000025 |
0.12 |
lowFe_TMEVA | 0.975000 | 0.0177 |
| Title | Cluster Plot | Dendrogram | e-value | e-value | e-value | Condition | Condition FDR | Condition Difference |
|---|---|---|---|---|---|---|---|---|
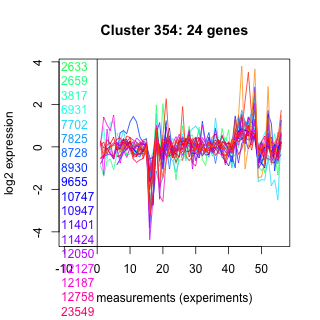
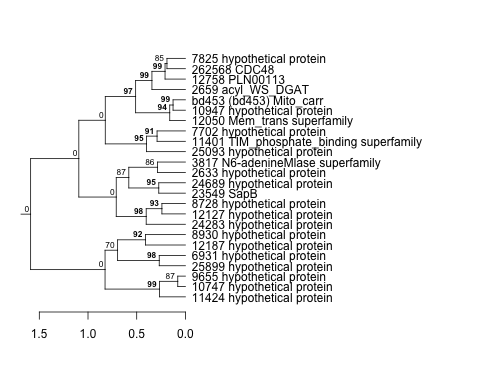
| Thaps_hclust_0354 |
 |
 |
0.027 |
0.032 |
0.78 |
lowN_TMEVA | 0.975000 | -0.0128 |
| Title | Cluster Plot | Dendrogram | e-value | e-value | e-value | Condition | Condition FDR | Condition Difference |
|---|---|---|---|---|---|---|---|---|
| Thaps_hclust_0151 |
 |
 |
0.015 |
0.13 |
16 |
lowFe_KTKB_Day3 | 0.975000 | 0.00967 |
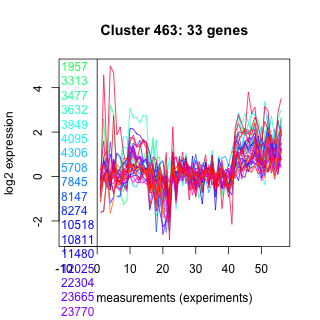
| Title | Cluster Plot | Dendrogram | e-value | e-value | e-value | Condition | Condition FDR | Condition Difference |
|---|---|---|---|---|---|---|---|---|
| Thaps_hclust_0463 |
 |
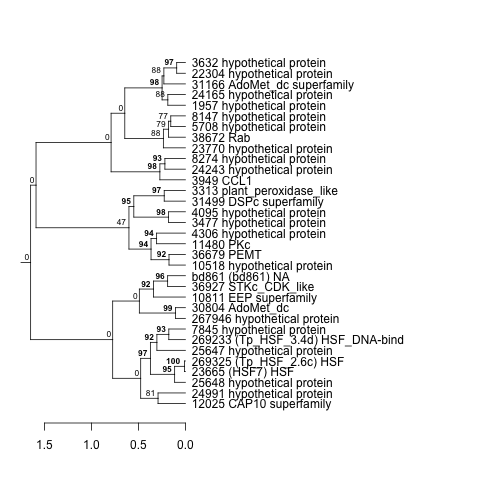 |
0.0000000063 |
0.000000075 |
0.78 |
lowFe_KTKB_Day3 | 0.974000 | -0.00852 |
| Title | Cluster Plot | Dendrogram | e-value | e-value | e-value | Condition | Condition FDR | Condition Difference |
|---|---|---|---|---|---|---|---|---|
| Thaps_hclust_0195 |
 |
 |
0.0031 |
0.024 |
0.00037 |
exponential_vs_stationary_24highlight | 0.974000 | 0.00478 |
| Title | Cluster Plot | Dendrogram | e-value | e-value | e-value | Condition | Condition FDR | Condition Difference |
|---|---|---|---|---|---|---|---|---|
| Thaps_hclust_0294 |
 |
 |
0.0033 |
0.13 |
0.53 |
lowSi_TMEVA | 0.974000 | -0.146 |
| Title | Cluster Plot | Dendrogram | e-value | e-value | e-value | Condition | Condition FDR | Condition Difference |
|---|---|---|---|---|---|---|---|---|
| Thaps_hclust_0039 |
 |
 |
2.2e-16 |
0.000000000000049 |
0.00083 |
lowFe_KTKB_Day3 | 0.974000 | 0.00625 |
| Title | Cluster Plot | Dendrogram | e-value | e-value | e-value | Condition | Condition FDR | Condition Difference |
|---|---|---|---|---|---|---|---|---|
| Thaps_hclust_0223 |
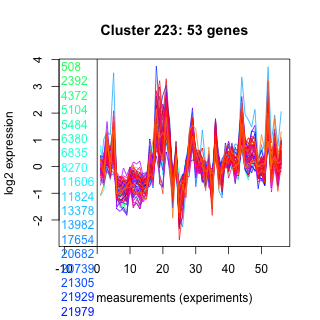 |
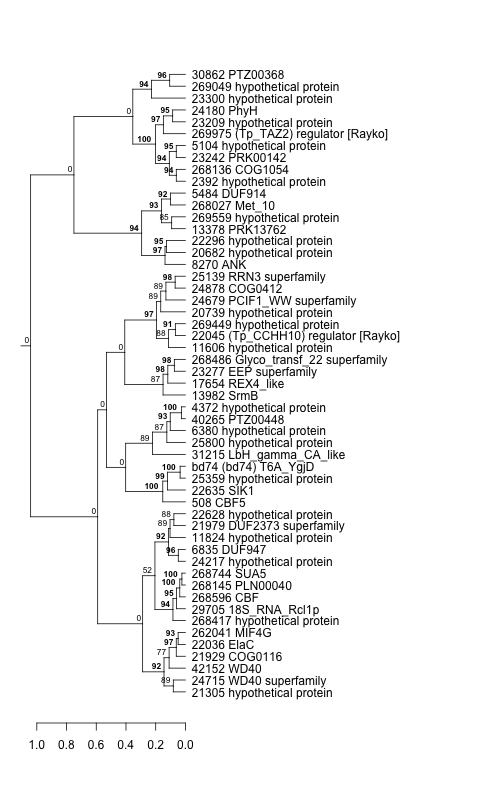 |
1.70006e-41 |
0.000000000000099 |
0.0011 |
lowFe_KTKB_Day3 | 0.974000 | 0.0067 |
| Title | Cluster Plot | Dendrogram | e-value | e-value | e-value | Condition | Condition FDR | Condition Difference |
|---|---|---|---|---|---|---|---|---|
| Thaps_hclust_0088 |
 |
 |
0.036 |
27 |
18 |
lowFe_TMEVA | 0.974000 | 0.0215 |
| Title | Cluster Plot | Dendrogram | e-value | e-value | e-value | Condition | Condition FDR | Condition Difference |
|---|---|---|---|---|---|---|---|---|
| Thaps_hclust_0153 |
 |
 |
0.0000021 |
0.0049 |
0.015 |
lowFe_KTKB_Day3 | 0.974000 | -0.0105 |
| Title | Cluster Plot | Dendrogram | e-value | e-value | e-value | Condition | Condition FDR | Condition Difference |
|---|---|---|---|---|---|---|---|---|
| Thaps_hclust_0147 |
 |
 |
0.0000023 |
0.000053 |
1.9 |
lowSi_TMEVA | 0.974000 | -0.156 |
| Title | Cluster Plot | Dendrogram | e-value | e-value | e-value | Condition | Condition FDR | Condition Difference |
|---|---|---|---|---|---|---|---|---|
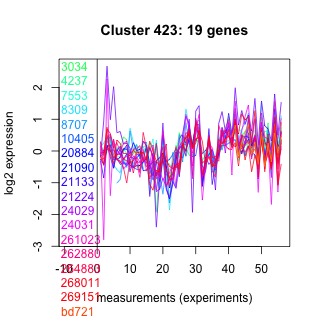
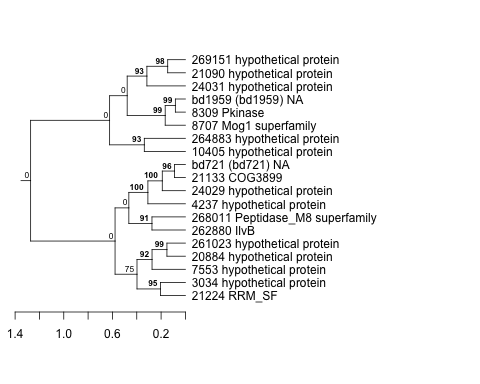
| Thaps_hclust_0423 |
 |
 |
0.00046 |
0.13 |
9.2 |
lowSi_TMEVA | 0.973000 | 0.149 |
| Title | Cluster Plot | Dendrogram | e-value | e-value | e-value | Condition | Condition FDR | Condition Difference |
|---|---|---|---|---|---|---|---|---|
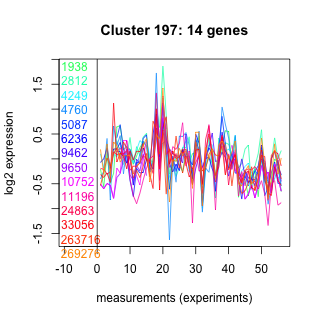
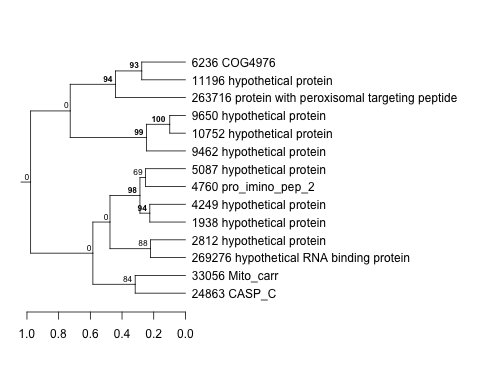
| Thaps_hclust_0197 |
 |
 |
0.12 |
0.3 |
0.65 |
highlight_arrays | 0.973000 | 0.00803 |
| Title | Cluster Plot | Dendrogram | e-value | e-value | e-value | Condition | Condition FDR | Condition Difference |
|---|---|---|---|---|---|---|---|---|
| Thaps_hclust_0408 |
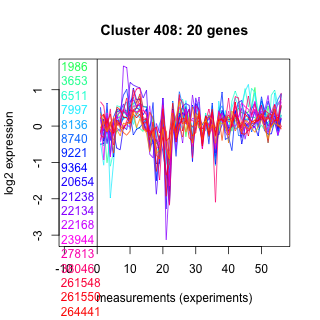 |
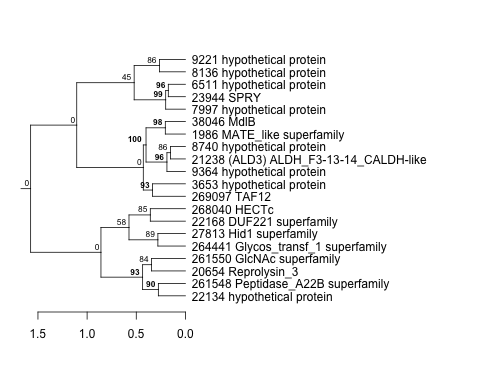 |
0.3 |
4.9 |
5.3 |
highlight_arrays | 0.973000 | -0.00634 |
| Thaps_hclust_0408 |
|
|
0.3 |
4.9 |
5.3 |
co2_elevated_expo_arrays | 0.968000 | 0.0268 |
| Title | Cluster Plot | Dendrogram | e-value | e-value | e-value | Condition | Condition FDR | Condition Difference |
|---|---|---|---|---|---|---|---|---|
| Thaps_hclust_0491 |
 |
 |
0.35 |
17 |
52 |
diel_light_vs_dark | 0.972000 | -0.0121 |
| Title | Cluster Plot | Dendrogram | e-value | e-value | e-value | Condition | Condition FDR | Condition Difference |
|---|---|---|---|---|---|---|---|---|
| Thaps_hclust_0276 |
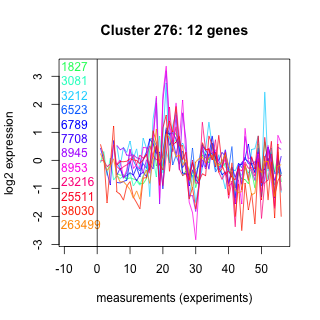 |
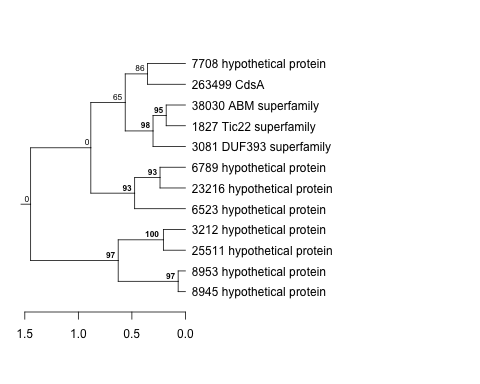 |
0.063 |
39 |
53 |
diel_light_vs_dark | 0.972000 | 0.0128 |
| Title | Cluster Plot | Dendrogram | e-value | e-value | e-value | Condition | Condition FDR | Condition Difference |
|---|---|---|---|---|---|---|---|---|
| Thaps_hclust_0357 |
 |
 |
0.077 |
0.1 |
0.81 |
diel_light_vs_dark | 0.972000 | -0.013 |
| Title | Cluster Plot | Dendrogram | e-value | e-value | e-value | Condition | Condition FDR | Condition Difference |
|---|---|---|---|---|---|---|---|---|
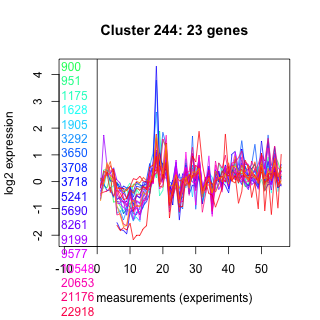
| Thaps_hclust_0244 |
 |
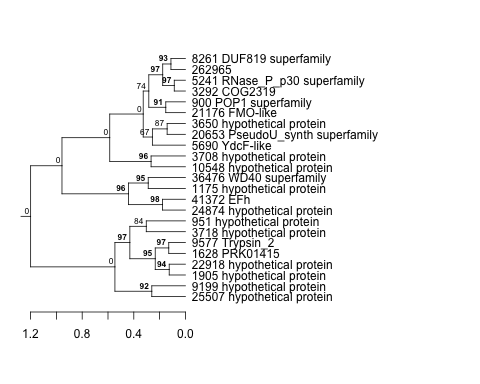 |
0.000000057 |
0.0001 |
4.1 |
highlight_arrays | 0.971000 | -0.00642 |
| Title | Cluster Plot | Dendrogram | e-value | e-value | e-value | Condition | Condition FDR | Condition Difference |
|---|---|---|---|---|---|---|---|---|
| Thaps_hclust_0167 |
 |
 |
1 |
15 |
160 |
highpH_TMEVA | 0.971000 | 0.0146 |
| Thaps_hclust_0167 |
|
|
1 |
15 |
160 |
lowFe_TMEVA | 0.970000 | -0.0235 |
| Title | Cluster Plot | Dendrogram | e-value | e-value | e-value | Condition | Condition FDR | Condition Difference |
|---|---|---|---|---|---|---|---|---|
| Thaps_hclust_0121 |
 |
 |
0.00021 |
0.77 |
30 |
co2_elevated_expo_arrays | 0.971000 | -0.0227 |
| Title | Cluster Plot | Dendrogram | e-value | e-value | e-value | Condition | Condition FDR | Condition Difference |
|---|---|---|---|---|---|---|---|---|
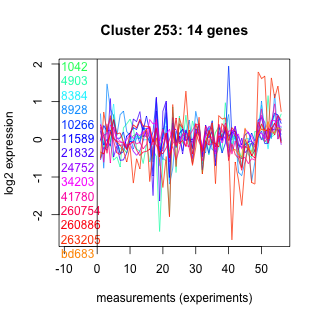
| Thaps_hclust_0253 |
 |
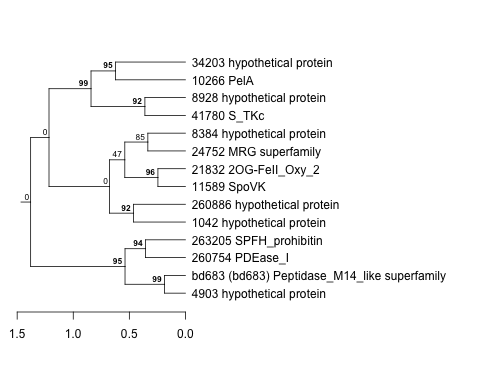 |
1.5 |
61 |
370 |
exponential_vs_stationary_24highlight | 0.970000 | -0.00647 |
| Title | Cluster Plot | Dendrogram | e-value | e-value | e-value | Condition | Condition FDR | Condition Difference |
|---|---|---|---|---|---|---|---|---|
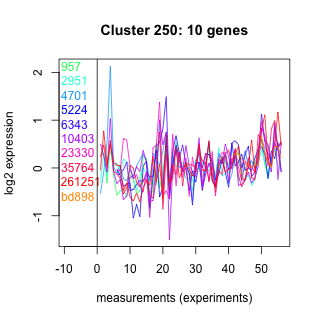
| Thaps_hclust_0250 |
 |
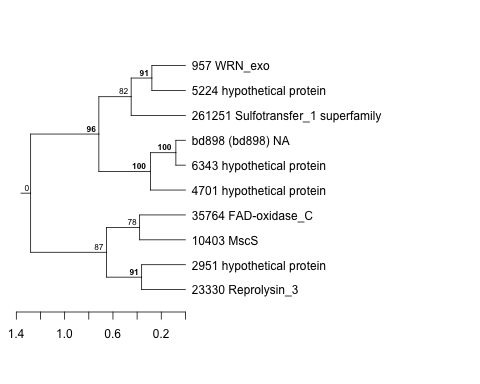 |
0.38 |
88 |
290 |
exponential_vs_stationary_24highlight | 0.970000 | 0.00745 |
| Title | Cluster Plot | Dendrogram | e-value | e-value | e-value | Condition | Condition FDR | Condition Difference |
|---|---|---|---|---|---|---|---|---|
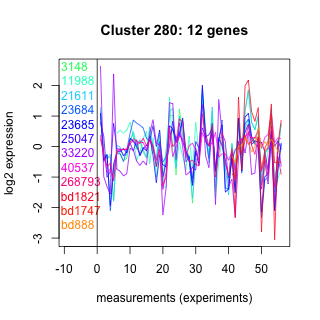
| Thaps_hclust_0280 |
 |
 |
0.75 |
0.64 |
81 |
diel_light_vs_dark | 0.970000 | 0.0154 |
| Title | Cluster Plot | Dendrogram | e-value | e-value | e-value | Condition | Condition FDR | Condition Difference |
|---|---|---|---|---|---|---|---|---|
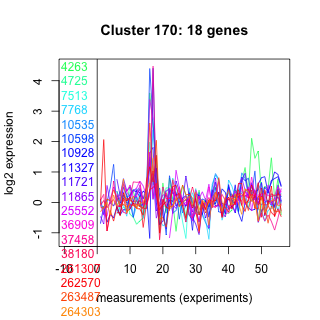
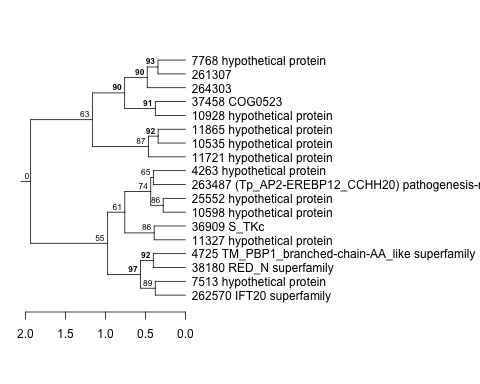
| Thaps_hclust_0170 |
 |
 |
0.028 |
1.8 |
150 |
lowFe_TMEVA | 0.970000 | 0.0226 |
| Title | Cluster Plot | Dendrogram | e-value | e-value | e-value | Condition | Condition FDR | Condition Difference |
|---|---|---|---|---|---|---|---|---|
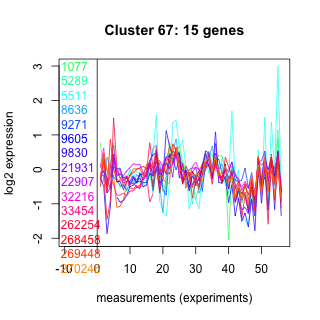
| Thaps_hclust_0067 |
 |
 |
0.0036 |
0.86 |
0.11 |
diel_light_vs_dark | 0.970000 | -0.0145 |
| Thaps_hclust_0067 |
|
|
0.0036 |
0.86 |
0.11 |
co2_elevated_expo_arrays | 0.968000 | 0.027 |
| Title | Cluster Plot | Dendrogram | e-value | e-value | e-value | Condition | Condition FDR | Condition Difference |
|---|---|---|---|---|---|---|---|---|
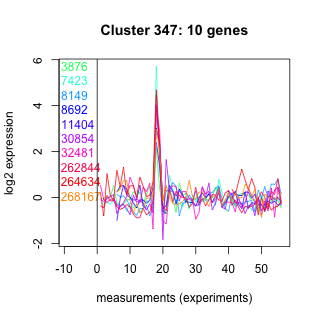
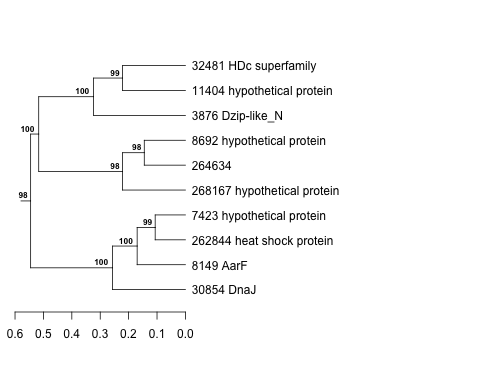
| Thaps_hclust_0347 |
 |
 |
1.2 |
0.85 |
91 |
diel_light_vs_dark | 0.970000 | -0.0175 |
| Title | Cluster Plot | Dendrogram | e-value | e-value | e-value | Condition | Condition FDR | Condition Difference |
|---|---|---|---|---|---|---|---|---|
| Thaps_hclust_0447 |
 |
 |
0.0005 |
0.0031 |
0.0041 |
diel_light_vs_dark | 0.970000 | 0.00999 |
| Title | Cluster Plot | Dendrogram | e-value | e-value | e-value | Condition | Condition FDR | Condition Difference |
|---|---|---|---|---|---|---|---|---|
| Thaps_hclust_0222 |
 |
 |
0.0000000000016 |
0.000000011 |
0.0008 |
co2_elevated_expo_arrays | 0.969000 | -0.0252 |
| Title | Cluster Plot | Dendrogram | e-value | e-value | e-value | Condition | Condition FDR | Condition Difference |
|---|---|---|---|---|---|---|---|---|
| Thaps_hclust_0257 |
 |
 |
Not available | Not available | Not available | co2_elevated_expo_arrays | 0.969000 | -0.0261 |
| Title | Cluster Plot | Dendrogram | e-value | e-value | e-value | Condition | Condition FDR | Condition Difference |
|---|---|---|---|---|---|---|---|---|
| Thaps_hclust_0380 |
 |
 |
1.1 |
5 |
8.7 |
co2_elevated_expo_arrays | 0.969000 | 0.0232 |
| Title | Cluster Plot | Dendrogram | e-value | e-value | e-value | Condition | Condition FDR | Condition Difference |
|---|---|---|---|---|---|---|---|---|
| Thaps_hclust_0130 |
 |
 |
0.64 |
15 |
13 |
co2_elevated_expo_arrays | 0.969000 | 0.0228 |
| Title | Cluster Plot | Dendrogram | e-value | e-value | e-value | Condition | Condition FDR | Condition Difference |
|---|---|---|---|---|---|---|---|---|
| Thaps_hclust_0057 |
 |
 |
1.5 |
1.7 |
12 |
BaP | 0.969000 | -0.0164 |
| Title | Cluster Plot | Dendrogram | e-value | e-value | e-value | Condition | Condition FDR | Condition Difference |
|---|---|---|---|---|---|---|---|---|
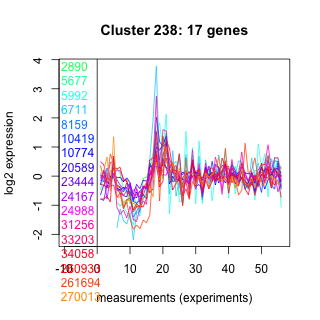
| Thaps_hclust_0238 |
 |
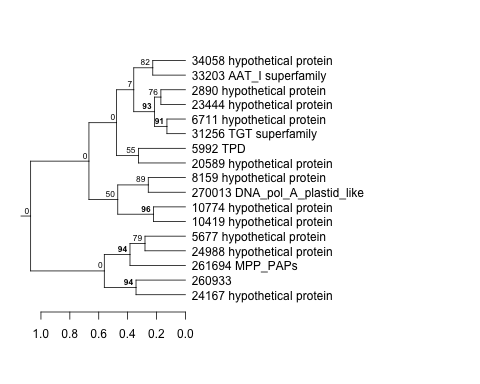 |
0.0018 |
0.095 |
0.069 |
co2_elevated_expo_arrays | 0.969000 | 0.0244 |
| Thaps_hclust_0238 |
|
|
0.0018 |
0.095 |
0.069 |
exponential_vs_stationary_24light | 0.969000 | 0.0171 |
| Title | Cluster Plot | Dendrogram | e-value | e-value | e-value | Condition | Condition FDR | Condition Difference |
|---|---|---|---|---|---|---|---|---|
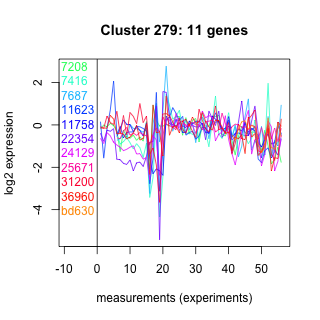
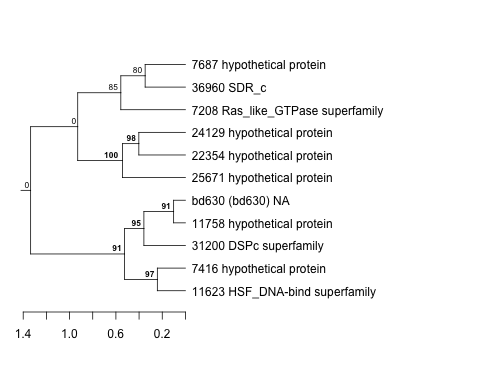
| Thaps_hclust_0279 |
 |
 |
2.7 |
22 |
38 |
diel_light_vs_dark | 0.969000 | -0.0176 |
| Title | Cluster Plot | Dendrogram | e-value | e-value | e-value | Condition | Condition FDR | Condition Difference |
|---|---|---|---|---|---|---|---|---|
| Thaps_hclust_0109 |
 |
 |
17 |
32 |
5.5 |
co2_elevated_expo_arrays | 0.969000 | -0.0245 |
| Title | Cluster Plot | Dendrogram | e-value | e-value | e-value | Condition | Condition FDR | Condition Difference |
|---|---|---|---|---|---|---|---|---|
| Thaps_hclust_0168 |
 |
 |
0.00000076 |
0.000000022 |
0.0000028 |
co2_elevated_expo_arrays | 0.969000 | -0.0238 |
| Title | Cluster Plot | Dendrogram | e-value | e-value | e-value | Condition | Condition FDR | Condition Difference |
|---|---|---|---|---|---|---|---|---|
| Thaps_hclust_0138 |
 |
 |
0.00000000000028 |
0.0000000011 |
0.0000065 |
diel_light_vs_dark | 0.969000 | -0.00879 |
| Thaps_hclust_0138 |
|
|
0.00000000000028 |
0.0000000011 |
0.0000065 |
exponential_vs_stationary_24highlight | 0.967000 | 0.00394 |
| Title | Cluster Plot | Dendrogram | e-value | e-value | e-value | Condition | Condition FDR | Condition Difference |
|---|---|---|---|---|---|---|---|---|
| Thaps_hclust_0317 |
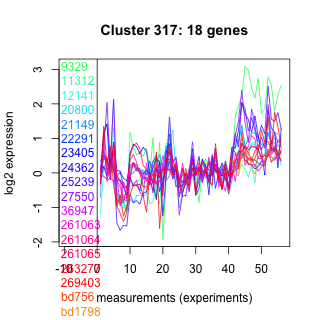 |
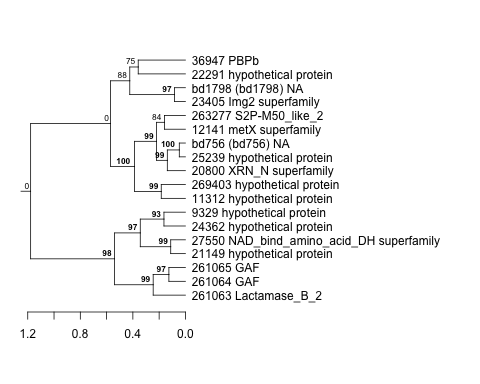 |
0.000000000082 |
0.00000001 |
0.00000042 |
co2_elevated_expo_arrays | 0.969000 | 0.0244 |
| Title | Cluster Plot | Dendrogram | e-value | e-value | e-value | Condition | Condition FDR | Condition Difference |
|---|---|---|---|---|---|---|---|---|
| Thaps_hclust_0264 |
 |
 |
0.0079 |
0.24 |
5.8 |
co2_elevated_expo_arrays | 0.969000 | -0.0246 |
| Thaps_hclust_0264 |
|
|
0.0079 |
0.24 |
5.8 |
exponential_vs_stationary_24highlight | 0.967000 | 0.00789 |
| Title | Cluster Plot | Dendrogram | e-value | e-value | e-value | Condition | Condition FDR | Condition Difference |
|---|---|---|---|---|---|---|---|---|
| Thaps_hclust_0207 |
 |
 |
0.0000000025 |
0.0000000037 |
0.1 |
co2_elevated_expo_arrays | 0.969000 | -0.0236 |
| Title | Cluster Plot | Dendrogram | e-value | e-value | e-value | Condition | Condition FDR | Condition Difference |
|---|---|---|---|---|---|---|---|---|
| Thaps_hclust_0206 |
 |
 |
0.00000000000075 |
0.0000028 |
3.5 |
co2_elevated_expo_arrays | 0.969000 | 0.0243 |
| Title | Cluster Plot | Dendrogram | e-value | e-value | e-value | Condition | Condition FDR | Condition Difference |
|---|---|---|---|---|---|---|---|---|
| Thaps_hclust_0314 |
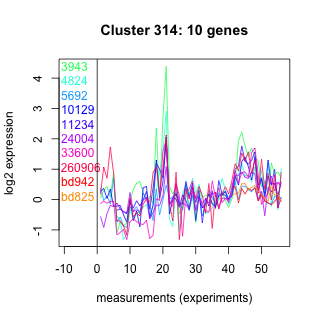 |
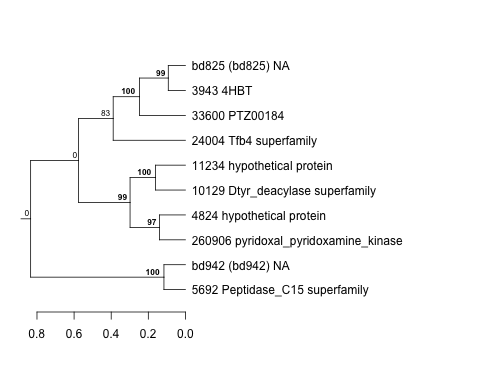 |
0.052 |
1.9 |
8.5 |
co2_elevated_expo_arrays | 0.969000 | -0.0277 |
| Title | Cluster Plot | Dendrogram | e-value | e-value | e-value | Condition | Condition FDR | Condition Difference |
|---|---|---|---|---|---|---|---|---|
| Thaps_hclust_0437 |
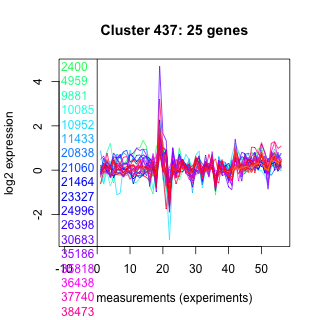 |
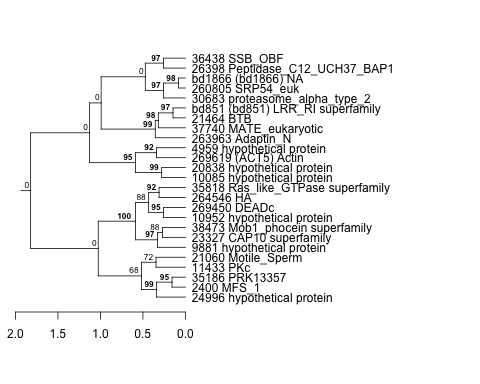 |
0.000000016 |
0.0023 |
3.3 |
co2_elevated_expo_arrays | 0.969000 | 0.0237 |
| Title | Cluster Plot | Dendrogram | e-value | e-value | e-value | Condition | Condition FDR | Condition Difference |
|---|---|---|---|---|---|---|---|---|
| Thaps_hclust_0202 |
 |
 |
0.0064 |
0.023 |
0.32 |
co2_elevated_expo_arrays | 0.968000 | -0.0342 |
| Title | Cluster Plot | Dendrogram | e-value | e-value | e-value | Condition | Condition FDR | Condition Difference |
|---|---|---|---|---|---|---|---|---|
| Thaps_hclust_0129 |
 |
 |
0.015 |
0.29 |
1 |
co2_elevated_expo_arrays | 0.968000 | -0.0269 |
| Title | Cluster Plot | Dendrogram | e-value | e-value | e-value | Condition | Condition FDR | Condition Difference |
|---|---|---|---|---|---|---|---|---|
| Thaps_hclust_0199 |
 |
 |
2.7e-19 |
0.000000062 |
0.00000065 |
co2_elevated_expo_arrays | 0.968000 | 0.028 |
| Title | Cluster Plot | Dendrogram | e-value | e-value | e-value | Condition | Condition FDR | Condition Difference |
|---|---|---|---|---|---|---|---|---|
| Thaps_hclust_0208 |
 |
|
1.2e-20 |
0.0000000000000057 |
0.0000000099 |
lowFe_KTKB_Day3 | 0.968000 | -0.00748 |
| Title | Cluster Plot | Dendrogram | e-value | e-value | e-value | Condition | Condition FDR | Condition Difference |
|---|---|---|---|---|---|---|---|---|
| Thaps_hclust_0133 |
 |
 |
0.95 |
2.2 |
2.4 |
co2_elevated_expo_arrays | 0.968000 | 0.0266 |
| Title | Cluster Plot | Dendrogram | e-value | e-value | e-value | Condition | Condition FDR | Condition Difference |
|---|---|---|---|---|---|---|---|---|
| Thaps_hclust_0315 |
 |
 |
0.01 |
0.93 |
0.53 |
lowFe_KTKB_Day3 | 0.968000 | 0.0136 |
| Title | Cluster Plot | Dendrogram | e-value | e-value | e-value | Condition | Condition FDR | Condition Difference |
|---|---|---|---|---|---|---|---|---|
| Thaps_hclust_0411 |
 |
 |
0.00079 |
0.0092 |
0.029 |
co2_elevated_expo_arrays | 0.968000 | 0.026 |
| Title | Cluster Plot | Dendrogram | e-value | e-value | e-value | Condition | Condition FDR | Condition Difference |
|---|---|---|---|---|---|---|---|---|
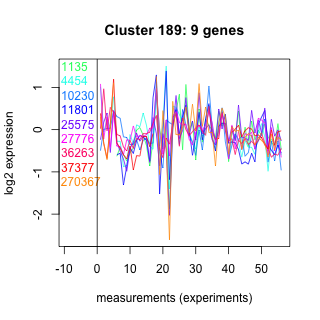
| Thaps_hclust_0189 |
 |
 |
0.0012 |
0.00048 |
0.015 |
lowFe_KTKB_Day5 | 0.968000 | 0.0138 |
| Title | Cluster Plot | Dendrogram | e-value | e-value | e-value | Condition | Condition FDR | Condition Difference |
|---|---|---|---|---|---|---|---|---|
| Thaps_hclust_0018 |
 |
 |
0.065 |
0.38 |
0.16 |
lowFe_KTKB_Day3 | 0.968000 | -0.0158 |
| Title | Cluster Plot | Dendrogram | e-value | e-value | e-value | Condition | Condition FDR | Condition Difference |
|---|---|---|---|---|---|---|---|---|
| Thaps_hclust_0247 |
 |
 |
8.7e-16 |
0.00000000045 |
0.0000019 |
co2_elevated_expo_arrays | 0.968000 | 0.0283 |
| Title | Cluster Plot | Dendrogram | e-value | e-value | e-value | Condition | Condition FDR | Condition Difference |
|---|---|---|---|---|---|---|---|---|
| Thaps_hclust_0181 |
 |
 |
0.000000035 |
0.14 |
0.84 |
lowFe_KTKB_Day5 | 0.968000 | 0.00984 |
| Title | Cluster Plot | Dendrogram | e-value | e-value | e-value | Condition | Condition FDR | Condition Difference |
|---|---|---|---|---|---|---|---|---|
| Thaps_hclust_0295 |
 |
 |
0.0000053 |
0.00095 |
0.0005 |
highlight_arrays | 0.967000 | 0.0102 |
| Title | Cluster Plot | Dendrogram | e-value | e-value | e-value | Condition | Condition FDR | Condition Difference |
|---|---|---|---|---|---|---|---|---|
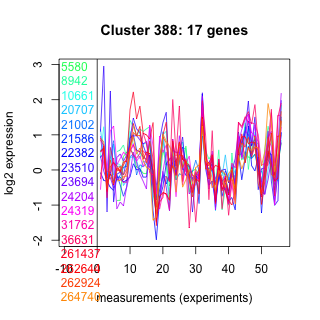
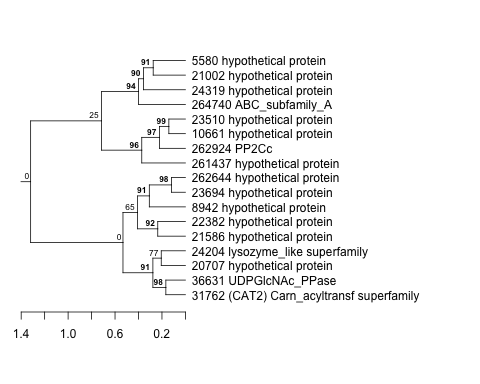
| Thaps_hclust_0172 |
 |
 |
0.000001 |
0.000011 |
0.014 |
diel_exponential_vs_stationary | 0.967000 | -0.00817 |
| Title | Cluster Plot | Dendrogram | e-value | e-value | e-value | Condition | Condition FDR | Condition Difference |
|---|---|---|---|---|---|---|---|---|
| Thaps_hclust_0388 |
 |
 |
0.0000000024 |
23 |
380 |
exponential_vs_stationary_24highlight | 0.967000 | -0.00706 |
| Title | Cluster Plot | Dendrogram | e-value | e-value | e-value | Condition | Condition FDR | Condition Difference |
|---|---|---|---|---|---|---|---|---|
| Thaps_hclust_0490 |
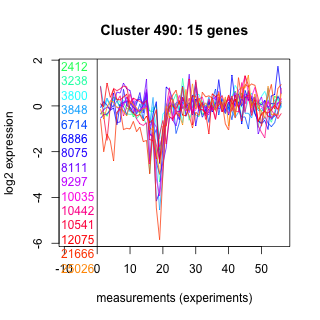 |
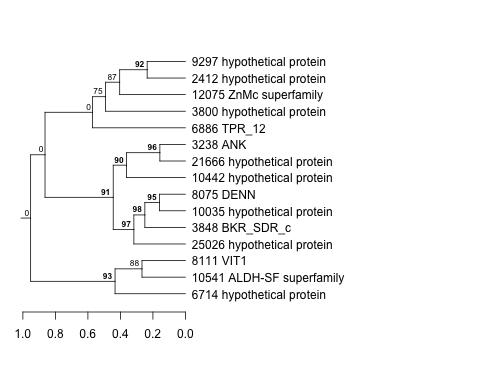 |
0.6 |
9.5 |
74 |
exponential_vs_stationary_24highlight | 0.967000 | 0.00777 |
| Title | Cluster Plot | Dendrogram | e-value | e-value | e-value | Condition | Condition FDR | Condition Difference |
|---|---|---|---|---|---|---|---|---|
| Thaps_hclust_0444 |
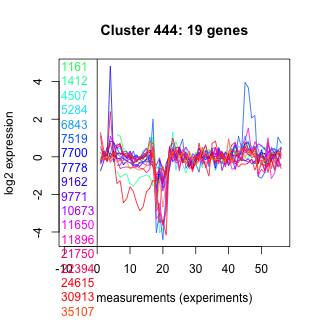 |
 |
14 |
140 |
1.6 |
lowN_TMEVA | 0.967000 | 0.0165 |
| Title | Cluster Plot | Dendrogram | e-value | e-value | e-value | Condition | Condition FDR | Condition Difference |
|---|---|---|---|---|---|---|---|---|
| Thaps_hclust_0036 |
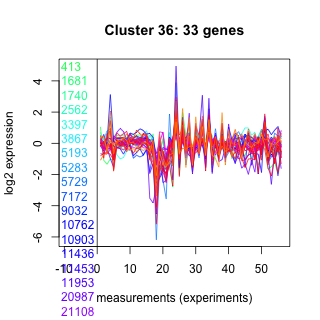 |
 |
0.0000003 |
0.00016 |
110 |
exponential_vs_stationary_24highlight | 0.967000 | -0.00467 |