Hierarchical Clusters
Displaying 501 - 600 of 7500
| Title | Cluster Plot | Dendrogram | e-value | e-value | e-value | Condition | Condition FDR | Condition Difference |
|---|---|---|---|---|---|---|---|---|
| Thaps_hclust_0040 |
 |
 |
1.8e-29 |
0.000000000042 |
0.00000000063 |
BaP | 1.000000 | |
| Thaps_hclust_0040 |
|
|
1.8e-29 |
0.000000000042 |
0.00000000063 |
exponential_vs_stationary_24highlight | 0.000526 | 0.348 |
| Thaps_hclust_0040 |
|
|
1.8e-29 |
0.000000000042 |
0.00000000063 |
co2_elevated_stat_arrays | 0.000658 | 0.54 |
| Thaps_hclust_0040 |
|
|
1.8e-29 |
0.000000000042 |
0.00000000063 |
lowtemp_TMEVA | 1.000000 | |
| Thaps_hclust_0040 |
|
|
1.8e-29 |
0.000000000042 |
0.00000000063 |
highpH_TMEVA | 1.000000 | |
| Thaps_hclust_0040 |
|
|
1.8e-29 |
0.000000000042 |
0.00000000063 |
co2_elevated_expo_arrays | 0.001390 | 0.817 |
| Thaps_hclust_0040 |
|
|
1.8e-29 |
0.000000000042 |
0.00000000063 |
lowFe_TMEVA | 1.000000 | |
| Thaps_hclust_0040 |
|
|
1.8e-29 |
0.000000000042 |
0.00000000063 |
exponential_vs_stationary_24light | 0.191000 | 0.35 |
| Thaps_hclust_0040 |
|
|
1.8e-29 |
0.000000000042 |
0.00000000063 |
lowN_TMEVA | 1.000000 | |
| Thaps_hclust_0040 |
|
|
1.8e-29 |
0.000000000042 |
0.00000000063 |
diel_exponential_vs_stationary | 0.998000 | 0.000908 |
| Title | Cluster Plot | Dendrogram | e-value | e-value | e-value | Condition | Condition FDR | Condition Difference |
|---|---|---|---|---|---|---|---|---|
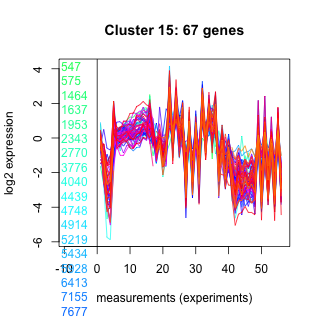
| Thaps_hclust_0015 |
 |
|
2.5e-25 |
7.4e-21 |
0.0000000011 |
highlight_arrays | 0.000442 | -1.29 |
| Thaps_hclust_0015 |
|
|
2.5e-25 |
7.4e-21 |
0.0000000011 |
diel_light_vs_dark | 0.000485 | -1.64 |
| Thaps_hclust_0015 |
|
|
2.5e-25 |
7.4e-21 |
0.0000000011 |
lowFe_KTKB_Day3 | 0.000862 | 0.949 |
| Thaps_hclust_0015 |
|
|
2.5e-25 |
7.4e-21 |
0.0000000011 |
lowFe_KTKB_Day5 | 0.249000 | 0.128 |
| Thaps_hclust_0015 |
|
|
2.5e-25 |
7.4e-21 |
0.0000000011 |
BaP | 0.000370 | -0.519 |
| Thaps_hclust_0015 |
|
|
2.5e-25 |
7.4e-21 |
0.0000000011 |
exponential_vs_stationary_24highlight | 0.000526 | 0.508 |
| Thaps_hclust_0015 |
|
|
2.5e-25 |
7.4e-21 |
0.0000000011 |
co2_elevated_stat_arrays | 0.125000 | 0.239 |
| Thaps_hclust_0015 |
|
|
2.5e-25 |
7.4e-21 |
0.0000000011 |
lowtemp_TMEVA | 0.012000 | 0.362 |
| Thaps_hclust_0015 |
|
|
2.5e-25 |
7.4e-21 |
0.0000000011 |
highpH_TMEVA | 0.000725 | -0.331 |
| Thaps_hclust_0015 |
|
|
2.5e-25 |
7.4e-21 |
0.0000000011 |
co2_elevated_expo_arrays | 0.250000 | 0.129 |
| Thaps_hclust_0015 |
|
|
2.5e-25 |
7.4e-21 |
0.0000000011 |
lowFe_TMEVA | 0.001040 | -1.31 |
| Thaps_hclust_0015 |
|
|
2.5e-25 |
7.4e-21 |
0.0000000011 |
exponential_vs_stationary_24light | 0.000581 | 2.9 |
| Thaps_hclust_0015 |
|
|
2.5e-25 |
7.4e-21 |
0.0000000011 |
lowN_TMEVA | 0.001190 | -2.83 |
| Thaps_hclust_0015 |
|
|
2.5e-25 |
7.4e-21 |
0.0000000011 |
diel_exponential_vs_stationary | 0.000602 | 1.97 |
| Thaps_hclust_0015 |
|
|
2.5e-25 |
7.4e-21 |
0.0000000011 |
lowSi_TMEVA | 0.001350 | -2.9 |
| Title | Cluster Plot | Dendrogram | e-value | e-value | e-value | Condition | Condition FDR | Condition Difference |
|---|---|---|---|---|---|---|---|---|
| Thaps_hclust_0343 |
 |
 |
9.7e-16 |
0.000000023 |
0.0000000024 |
lowN_TMEVA | 1.000000 | 0.00376 |
| Thaps_hclust_0343 |
|
|
9.7e-16 |
0.000000023 |
0.0000000024 |
diel_exponential_vs_stationary | 0.816000 | -0.0424 |
| Thaps_hclust_0343 |
|
|
9.7e-16 |
0.000000023 |
0.0000000024 |
lowSi_TMEVA | 1.000000 | 0.0364 |
| Thaps_hclust_0343 |
|
|
9.7e-16 |
0.000000023 |
0.0000000024 |
highlight_arrays | 0.000442 | 0.875 |
| Thaps_hclust_0343 |
|
|
9.7e-16 |
0.000000023 |
0.0000000024 |
diel_light_vs_dark | 0.846000 | 0.0475 |
| Thaps_hclust_0343 |
|
|
9.7e-16 |
0.000000023 |
0.0000000024 |
lowFe_KTKB_Day3 | 0.004290 | -0.509 |
| Thaps_hclust_0343 |
|
|
9.7e-16 |
0.000000023 |
0.0000000024 |
lowFe_KTKB_Day5 | 0.884000 | 0.029 |
| Thaps_hclust_0343 |
|
|
9.7e-16 |
0.000000023 |
0.0000000024 |
BaP | 0.026900 | 0.379 |
| Thaps_hclust_0343 |
|
|
9.7e-16 |
0.000000023 |
0.0000000024 |
exponential_vs_stationary_24highlight | 0.633000 | 0.0461 |
| Thaps_hclust_0343 |
|
|
9.7e-16 |
0.000000023 |
0.0000000024 |
co2_elevated_stat_arrays | 0.193000 | 0.258 |
| Thaps_hclust_0343 |
|
|
9.7e-16 |
0.000000023 |
0.0000000024 |
lowtemp_TMEVA | 0.088300 | -0.356 |
| Thaps_hclust_0343 |
|
|
9.7e-16 |
0.000000023 |
0.0000000024 |
highpH_TMEVA | 0.943000 | 0.0172 |
| Thaps_hclust_0343 |
|
|
9.7e-16 |
0.000000023 |
0.0000000024 |
co2_elevated_expo_arrays | 0.833000 | 0.0686 |
| Thaps_hclust_0343 |
|
|
9.7e-16 |
0.000000023 |
0.0000000024 |
lowFe_TMEVA | 0.028000 | -0.447 |
| Thaps_hclust_0343 |
|
|
9.7e-16 |
0.000000023 |
0.0000000024 |
exponential_vs_stationary_24light | 0.813000 | -0.085 |
| Title | Cluster Plot | Dendrogram | e-value | e-value | e-value | Condition | Condition FDR | Condition Difference |
|---|---|---|---|---|---|---|---|---|
| Thaps_hclust_0208 |
 |
|
1.2e-20 |
0.0000000000000057 |
0.0000000099 |
diel_light_vs_dark | 0.000485 | 0.714 |
| Thaps_hclust_0208 |
|
|
1.2e-20 |
0.0000000000000057 |
0.0000000099 |
lowFe_KTKB_Day3 | 0.968000 | -0.00748 |
| Thaps_hclust_0208 |
|
|
1.2e-20 |
0.0000000000000057 |
0.0000000099 |
lowFe_KTKB_Day5 | 0.561000 | -0.0717 |
| Thaps_hclust_0208 |
|
|
1.2e-20 |
0.0000000000000057 |
0.0000000099 |
BaP | 0.000370 | 0.466 |
| Thaps_hclust_0208 |
|
|
1.2e-20 |
0.0000000000000057 |
0.0000000099 |
exponential_vs_stationary_24highlight | 0.000526 | 0.404 |
| Thaps_hclust_0208 |
|
|
1.2e-20 |
0.0000000000000057 |
0.0000000099 |
co2_elevated_stat_arrays | 0.000658 | -0.474 |
| Thaps_hclust_0208 |
|
|
1.2e-20 |
0.0000000000000057 |
0.0000000099 |
lowtemp_TMEVA | 0.800000 | 0.0444 |
| Thaps_hclust_0208 |
|
|
1.2e-20 |
0.0000000000000057 |
0.0000000099 |
highpH_TMEVA | 0.329000 | 0.102 |
| Thaps_hclust_0208 |
|
|
1.2e-20 |
0.0000000000000057 |
0.0000000099 |
co2_elevated_expo_arrays | 0.985000 | -0.014 |
| Thaps_hclust_0208 |
|
|
1.2e-20 |
0.0000000000000057 |
0.0000000099 |
lowFe_TMEVA | 0.996000 | -0.00415 |
| Thaps_hclust_0208 |
|
|
1.2e-20 |
0.0000000000000057 |
0.0000000099 |
exponential_vs_stationary_24light | 0.000581 | 0.911 |
| Thaps_hclust_0208 |
|
|
1.2e-20 |
0.0000000000000057 |
0.0000000099 |
lowN_TMEVA | 0.001190 | -0.59 |
| Thaps_hclust_0208 |
|
|
1.2e-20 |
0.0000000000000057 |
0.0000000099 |
diel_exponential_vs_stationary | 0.099000 | 0.161 |
| Thaps_hclust_0208 |
|
|
1.2e-20 |
0.0000000000000057 |
0.0000000099 |
lowSi_TMEVA | 0.445000 | -0.334 |
| Thaps_hclust_0208 |
|
|
1.2e-20 |
0.0000000000000057 |
0.0000000099 |
highlight_arrays | 0.002290 | -0.269 |
| Title | Cluster Plot | Dendrogram | e-value | e-value | e-value | Condition | Condition FDR | Condition Difference |
|---|---|---|---|---|---|---|---|---|
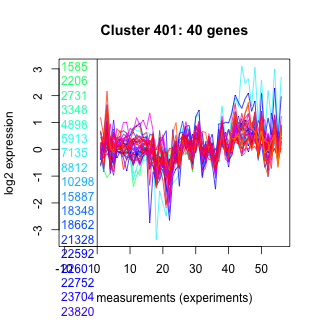
| Thaps_hclust_0401 |
 |
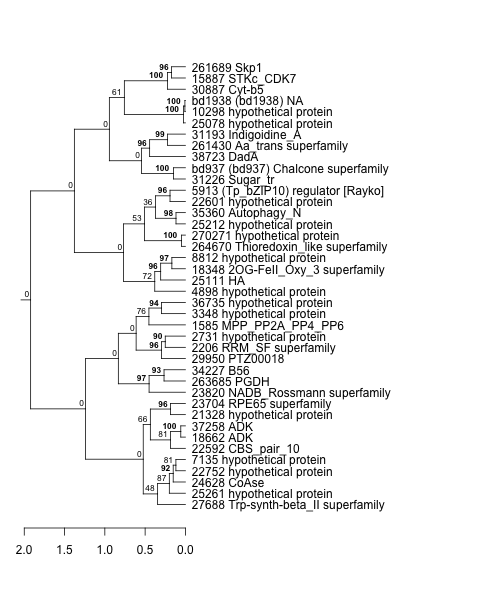 |
3.5e-16 |
0.000000000077 |
0.000000012 |
diel_light_vs_dark | 0.716000 | 0.0704 |
| Thaps_hclust_0401 |
|
|
3.5e-16 |
0.000000000077 |
0.000000012 |
lowFe_KTKB_Day3 | 0.294000 | -0.179 |
| Thaps_hclust_0401 |
|
|
3.5e-16 |
0.000000000077 |
0.000000012 |
lowFe_KTKB_Day5 | 0.477000 | 0.107 |
| Thaps_hclust_0401 |
|
|
3.5e-16 |
0.000000000077 |
0.000000012 |
BaP | 0.000370 | -0.574 |
| Thaps_hclust_0401 |
|
|
3.5e-16 |
0.000000000077 |
0.000000012 |
exponential_vs_stationary_24highlight | 0.000926 | -0.221 |
| Thaps_hclust_0401 |
|
|
3.5e-16 |
0.000000000077 |
0.000000012 |
co2_elevated_stat_arrays | 0.123000 | -0.271 |
| Thaps_hclust_0401 |
|
|
3.5e-16 |
0.000000000077 |
0.000000012 |
lowtemp_TMEVA | 1.000000 | 0.0000689 |
| Thaps_hclust_0401 |
|
|
3.5e-16 |
0.000000000077 |
0.000000012 |
highpH_TMEVA | 0.845000 | 0.032 |
| Thaps_hclust_0401 |
|
|
3.5e-16 |
0.000000000077 |
0.000000012 |
co2_elevated_expo_arrays | 0.943000 | -0.0366 |
| Thaps_hclust_0401 |
|
|
3.5e-16 |
0.000000000077 |
0.000000012 |
lowFe_TMEVA | 0.996000 | -0.00594 |
| Thaps_hclust_0401 |
|
|
3.5e-16 |
0.000000000077 |
0.000000012 |
exponential_vs_stationary_24light | 0.008410 | -0.576 |
| Thaps_hclust_0401 |
|
|
3.5e-16 |
0.000000000077 |
0.000000012 |
lowN_TMEVA | 0.005770 | 0.607 |
| Thaps_hclust_0401 |
|
|
3.5e-16 |
0.000000000077 |
0.000000012 |
diel_exponential_vs_stationary | 0.000602 | -0.459 |
| Thaps_hclust_0401 |
|
|
3.5e-16 |
0.000000000077 |
0.000000012 |
lowSi_TMEVA | 0.976000 | -0.147 |
| Thaps_hclust_0401 |
|
|
3.5e-16 |
0.000000000077 |
0.000000012 |
highlight_arrays | 0.000442 | 0.347 |
| Title | Cluster Plot | Dendrogram | e-value | e-value | e-value | Condition | Condition FDR | Condition Difference |
|---|---|---|---|---|---|---|---|---|
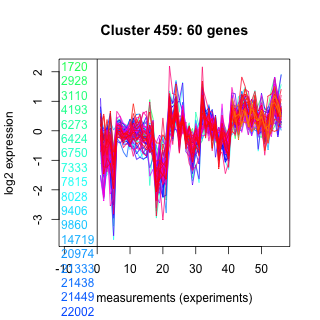
| Thaps_hclust_0459 |
 |
 |
0.00000000015 |
0.0000000056 |
0.000000015 |
exponential_vs_stationary_24highlight | 0.986000 | 0.00134 |
| Thaps_hclust_0459 |
|
|
0.00000000015 |
0.0000000056 |
0.000000015 |
co2_elevated_stat_arrays | 0.733000 | -0.0933 |
| Thaps_hclust_0459 |
|
|
0.00000000015 |
0.0000000056 |
0.000000015 |
lowtemp_TMEVA | 0.000735 | -1.57 |
| Thaps_hclust_0459 |
|
|
0.00000000015 |
0.0000000056 |
0.000000015 |
highpH_TMEVA | 0.103000 | -0.163 |
| Thaps_hclust_0459 |
|
|
0.00000000015 |
0.0000000056 |
0.000000015 |
co2_elevated_expo_arrays | 0.098800 | -0.16 |
| Thaps_hclust_0459 |
|
|
0.00000000015 |
0.0000000056 |
0.000000015 |
lowFe_TMEVA | 0.001040 | -0.951 |
| Thaps_hclust_0459 |
|
|
0.00000000015 |
0.0000000056 |
0.000000015 |
exponential_vs_stationary_24light | 0.343000 | -0.216 |
| Thaps_hclust_0459 |
|
|
0.00000000015 |
0.0000000056 |
0.000000015 |
lowN_TMEVA | 0.019000 | -0.455 |
| Thaps_hclust_0459 |
|
|
0.00000000015 |
0.0000000056 |
0.000000015 |
diel_exponential_vs_stationary | 0.000602 | 0.719 |
| Thaps_hclust_0459 |
|
|
0.00000000015 |
0.0000000056 |
0.000000015 |
lowSi_TMEVA | 0.002330 | -0.657 |
| Thaps_hclust_0459 |
|
|
0.00000000015 |
0.0000000056 |
0.000000015 |
highlight_arrays | 0.391000 | 0.0892 |
| Thaps_hclust_0459 |
|
|
0.00000000015 |
0.0000000056 |
0.000000015 |
diel_light_vs_dark | 0.000485 | -0.411 |
| Thaps_hclust_0459 |
|
|
0.00000000015 |
0.0000000056 |
0.000000015 |
lowFe_KTKB_Day3 | 0.010500 | -0.299 |
| Thaps_hclust_0459 |
|
|
0.00000000015 |
0.0000000056 |
0.000000015 |
lowFe_KTKB_Day5 | 0.001320 | -0.338 |
| Thaps_hclust_0459 |
|
|
0.00000000015 |
0.0000000056 |
0.000000015 |
BaP | 0.000370 | -1.39 |
| Title | Cluster Plot | Dendrogram | e-value | e-value | e-value | Condition | Condition FDR | Condition Difference |
|---|---|---|---|---|---|---|---|---|
| Thaps_hclust_0255 |
 |
 |
1.4e-28 |
0.0000000000000024 |
0.000000029 |
lowN_TMEVA | 1.000000 | |
| Thaps_hclust_0255 |
|
|
1.4e-28 |
0.0000000000000024 |
0.000000029 |
diel_exponential_vs_stationary | 0.010200 | 0.533 |
| Thaps_hclust_0255 |
|
|
1.4e-28 |
0.0000000000000024 |
0.000000029 |
lowSi_TMEVA | 1.000000 | |
| Thaps_hclust_0255 |
|
|
1.4e-28 |
0.0000000000000024 |
0.000000029 |
highlight_arrays | 0.000442 | -1.16 |
| Thaps_hclust_0255 |
|
|
1.4e-28 |
0.0000000000000024 |
0.000000029 |
diel_light_vs_dark | 0.000485 | -0.853 |
| Thaps_hclust_0255 |
|
|
1.4e-28 |
0.0000000000000024 |
0.000000029 |
lowFe_KTKB_Day3 | 1.000000 | |
| Thaps_hclust_0255 |
|
|
1.4e-28 |
0.0000000000000024 |
0.000000029 |
lowFe_KTKB_Day5 | 1.000000 | |
| Thaps_hclust_0255 |
|
|
1.4e-28 |
0.0000000000000024 |
0.000000029 |
BaP | 1.000000 | |
| Thaps_hclust_0255 |
|
|
1.4e-28 |
0.0000000000000024 |
0.000000029 |
exponential_vs_stationary_24highlight | 0.002870 | -0.36 |
| Thaps_hclust_0255 |
|
|
1.4e-28 |
0.0000000000000024 |
0.000000029 |
co2_elevated_stat_arrays | 0.006310 | 0.6 |
| Thaps_hclust_0255 |
|
|
1.4e-28 |
0.0000000000000024 |
0.000000029 |
lowtemp_TMEVA | 1.000000 | |
| Thaps_hclust_0255 |
|
|
1.4e-28 |
0.0000000000000024 |
0.000000029 |
highpH_TMEVA | 1.000000 | |
| Thaps_hclust_0255 |
|
|
1.4e-28 |
0.0000000000000024 |
0.000000029 |
co2_elevated_expo_arrays | 0.903000 | 0.0569 |
| Thaps_hclust_0255 |
|
|
1.4e-28 |
0.0000000000000024 |
0.000000029 |
lowFe_TMEVA | 1.000000 | |
| Thaps_hclust_0255 |
|
|
1.4e-28 |
0.0000000000000024 |
0.000000029 |
exponential_vs_stationary_24light | 0.576000 | 0.224 |