Hierarchical Clusters
Displaying 6201 - 6300 of 7500
| Title | Cluster Plot | Dendrogram | e-value | e-value | e-value | Condition | Condition FDR | Condition Difference |
|---|---|---|---|---|---|---|---|---|
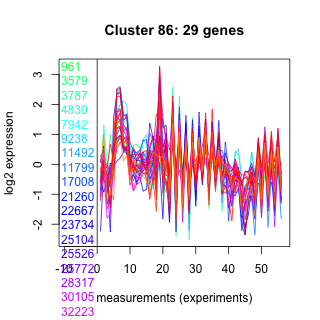
| Thaps_hclust_0087 |
 |
 |
0.00000000000011 |
0.000026 |
0.028 |
lowFe_KTKB_Day5 | 0.496000 | -0.119 |
| Thaps_hclust_0087 |
|
|
0.00000000000011 |
0.000026 |
0.028 |
BaP | 0.073200 | -0.295 |
| Thaps_hclust_0087 |
|
|
0.00000000000011 |
0.000026 |
0.028 |
exponential_vs_stationary_24highlight | 0.554000 | 0.0557 |
| Thaps_hclust_0087 |
|
|
0.00000000000011 |
0.000026 |
0.028 |
co2_elevated_stat_arrays | 0.801000 | -0.07 |
| Thaps_hclust_0087 |
|
|
0.00000000000011 |
0.000026 |
0.028 |
lowtemp_TMEVA | 0.063900 | 0.372 |
| Thaps_hclust_0087 |
|
|
0.00000000000011 |
0.000026 |
0.028 |
highpH_TMEVA | 0.000725 | -0.475 |
| Thaps_hclust_0087 |
|
|
0.00000000000011 |
0.000026 |
0.028 |
co2_elevated_expo_arrays | 0.006820 | 0.295 |
| Thaps_hclust_0087 |
|
|
0.00000000000011 |
0.000026 |
0.028 |
lowFe_TMEVA | 0.218000 | 0.289 |
| Thaps_hclust_0087 |
|
|
0.00000000000011 |
0.000026 |
0.028 |
exponential_vs_stationary_24light | 0.000581 | 1.03 |
| Thaps_hclust_0087 |
|
|
0.00000000000011 |
0.000026 |
0.028 |
lowN_TMEVA | 0.097700 | -0.436 |
| Title | Cluster Plot | Dendrogram | e-value | e-value | e-value | Condition | Condition FDR | Condition Difference |
|---|---|---|---|---|---|---|---|---|
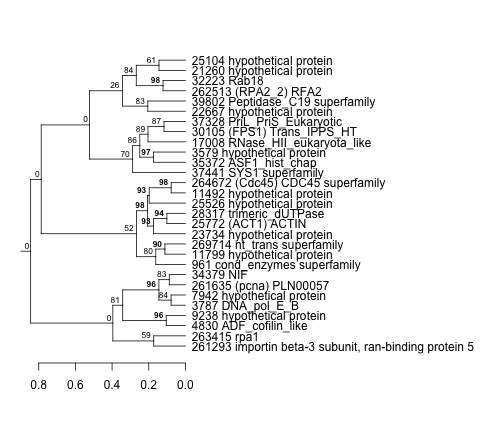
| Thaps_hclust_0086 |
 |
 |
0.0000000068 |
0.01 |
0.0037 |
diel_exponential_vs_stationary | 0.868000 | 0.0336 |
| Thaps_hclust_0086 |
|
|
0.0000000068 |
0.01 |
0.0037 |
lowSi_TMEVA | 0.095300 | -0.596 |
| Thaps_hclust_0086 |
|
|
0.0000000068 |
0.01 |
0.0037 |
highlight_arrays | 0.000442 | -0.578 |
| Thaps_hclust_0086 |
|
|
0.0000000068 |
0.01 |
0.0037 |
diel_light_vs_dark | 0.000485 | 1.42 |
| Thaps_hclust_0086 |
|
|
0.0000000068 |
0.01 |
0.0037 |
lowFe_KTKB_Day3 | 0.903000 | -0.0347 |
| Thaps_hclust_0086 |
|
|
0.0000000068 |
0.01 |
0.0037 |
lowFe_KTKB_Day5 | 0.362000 | 0.158 |
| Thaps_hclust_0086 |
|
|
0.0000000068 |
0.01 |
0.0037 |
BaP | 0.009470 | 0.44 |
| Thaps_hclust_0086 |
|
|
0.0000000068 |
0.01 |
0.0037 |
exponential_vs_stationary_24highlight | 0.052900 | 0.164 |
| Thaps_hclust_0086 |
|
|
0.0000000068 |
0.01 |
0.0037 |
co2_elevated_stat_arrays | 0.206000 | -0.256 |
| Thaps_hclust_0086 |
|
|
0.0000000068 |
0.01 |
0.0037 |
lowtemp_TMEVA | 0.297000 | 0.226 |
| Thaps_hclust_0086 |
|
|
0.0000000068 |
0.01 |
0.0037 |
highpH_TMEVA | 0.000725 | -0.507 |
| Thaps_hclust_0086 |
|
|
0.0000000068 |
0.01 |
0.0037 |
co2_elevated_expo_arrays | 0.001390 | 0.384 |
| Thaps_hclust_0086 |
|
|
0.0000000068 |
0.01 |
0.0037 |
lowFe_TMEVA | 0.630000 | 0.143 |
| Thaps_hclust_0086 |
|
|
0.0000000068 |
0.01 |
0.0037 |
exponential_vs_stationary_24light | 0.000581 | 1.24 |
| Thaps_hclust_0086 |
|
|
0.0000000068 |
0.01 |
0.0037 |
lowN_TMEVA | 0.011400 | -0.647 |
| Title | Cluster Plot | Dendrogram | e-value | e-value | e-value | Condition | Condition FDR | Condition Difference |
|---|---|---|---|---|---|---|---|---|
| Thaps_hclust_0085 |
 |
 |
0.000012 |
0.0024 |
0.37 |
lowN_TMEVA | 0.035200 | -0.577 |
| Thaps_hclust_0085 |
|
|
0.000012 |
0.0024 |
0.37 |
diel_exponential_vs_stationary | 0.059600 | 0.283 |
| Thaps_hclust_0085 |
|
|
0.000012 |
0.0024 |
0.37 |
lowSi_TMEVA | 0.723000 | -0.278 |
| Thaps_hclust_0085 |
|
|
0.000012 |
0.0024 |
0.37 |
highlight_arrays | 0.000442 | -0.542 |
| Thaps_hclust_0085 |
|
|
0.000012 |
0.0024 |
0.37 |
diel_light_vs_dark | 0.000485 | 0.908 |
| Thaps_hclust_0085 |
|
|
0.000012 |
0.0024 |
0.37 |
lowFe_KTKB_Day3 | 0.447000 | 0.178 |
| Thaps_hclust_0085 |
|
|
0.000012 |
0.0024 |
0.37 |
lowFe_KTKB_Day5 | 0.090100 | 0.294 |
| Thaps_hclust_0085 |
|
|
0.000012 |
0.0024 |
0.37 |
BaP | 0.744000 | -0.0736 |
| Thaps_hclust_0085 |
|
|
0.000012 |
0.0024 |
0.37 |
exponential_vs_stationary_24highlight | 0.000526 | 0.429 |
| Thaps_hclust_0085 |
|
|
0.000012 |
0.0024 |
0.37 |
co2_elevated_stat_arrays | 0.962000 | 0.0105 |
| Thaps_hclust_0085 |
|
|
0.000012 |
0.0024 |
0.37 |
lowtemp_TMEVA | 0.673000 | 0.109 |
| Thaps_hclust_0085 |
|
|
0.000012 |
0.0024 |
0.37 |
highpH_TMEVA | 0.074600 | -0.253 |
| Thaps_hclust_0085 |
|
|
0.000012 |
0.0024 |
0.37 |
co2_elevated_expo_arrays | 0.001390 | 0.345 |
| Thaps_hclust_0085 |
|
|
0.000012 |
0.0024 |
0.37 |
lowFe_TMEVA | 0.826000 | 0.0834 |
| Thaps_hclust_0085 |
|
|
0.000012 |
0.0024 |
0.37 |
exponential_vs_stationary_24light | 0.000581 | 1.46 |
| Title | Cluster Plot | Dendrogram | e-value | e-value | e-value | Condition | Condition FDR | Condition Difference |
|---|---|---|---|---|---|---|---|---|
| Thaps_hclust_0084 |
 |
 |
0.0000000000035 |
0.00000025 |
0.12 |
exponential_vs_stationary_24light | 0.058300 | 0.527 |
| Thaps_hclust_0084 |
|
|
0.0000000000035 |
0.00000025 |
0.12 |
lowN_TMEVA | 0.293000 | -0.335 |
| Thaps_hclust_0084 |
|
|
0.0000000000035 |
0.00000025 |
0.12 |
diel_exponential_vs_stationary | 0.844000 | 0.0419 |
| Thaps_hclust_0084 |
|
|
0.0000000000035 |
0.00000025 |
0.12 |
lowSi_TMEVA | 1.000000 | -0.0169 |
| Thaps_hclust_0084 |
|
|
0.0000000000035 |
0.00000025 |
0.12 |
highlight_arrays | 0.001570 | -0.437 |
| Thaps_hclust_0084 |
|
|
0.0000000000035 |
0.00000025 |
0.12 |
diel_light_vs_dark | 0.000485 | 0.903 |
| Thaps_hclust_0084 |
|
|
0.0000000000035 |
0.00000025 |
0.12 |
lowFe_KTKB_Day3 | 0.926000 | 0.0272 |
| Thaps_hclust_0084 |
|
|
0.0000000000035 |
0.00000025 |
0.12 |
lowFe_KTKB_Day5 | 0.820000 | -0.0477 |
| Thaps_hclust_0084 |
|
|
0.0000000000035 |
0.00000025 |
0.12 |
BaP | 0.017500 | 0.443 |
| Thaps_hclust_0084 |
|
|
0.0000000000035 |
0.00000025 |
0.12 |
exponential_vs_stationary_24highlight | 0.579000 | 0.0579 |
| Thaps_hclust_0084 |
|
|
0.0000000000035 |
0.00000025 |
0.12 |
co2_elevated_stat_arrays | 0.599000 | 0.132 |
| Thaps_hclust_0084 |
|
|
0.0000000000035 |
0.00000025 |
0.12 |
lowtemp_TMEVA | 0.645000 | -0.117 |
| Thaps_hclust_0084 |
|
|
0.0000000000035 |
0.00000025 |
0.12 |
highpH_TMEVA | 0.510000 | -0.103 |
| Thaps_hclust_0084 |
|
|
0.0000000000035 |
0.00000025 |
0.12 |
co2_elevated_expo_arrays | 0.213000 | 0.182 |
| Thaps_hclust_0084 |
|
|
0.0000000000035 |
0.00000025 |
0.12 |
lowFe_TMEVA | 0.975000 | 0.0177 |
| Title | Cluster Plot | Dendrogram | e-value | e-value | e-value | Condition | Condition FDR | Condition Difference |
|---|---|---|---|---|---|---|---|---|
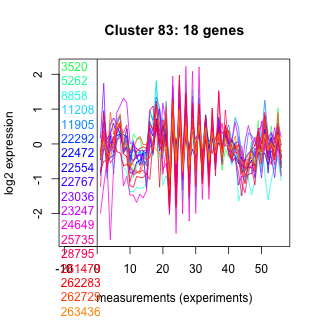
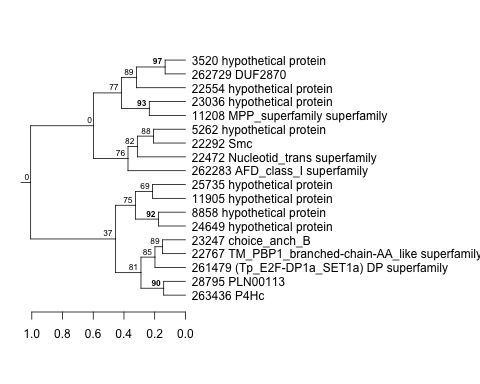
| Thaps_hclust_0083 |
 |
 |
0.0039 |
6.3 |
14 |
lowFe_TMEVA | 0.316000 | 0.291 |
| Thaps_hclust_0083 |
|
|
0.0039 |
6.3 |
14 |
exponential_vs_stationary_24light | 0.173000 | 0.448 |
| Thaps_hclust_0083 |
|
|
0.0039 |
6.3 |
14 |
lowN_TMEVA | 0.266000 | -0.387 |
| Thaps_hclust_0083 |
|
|
0.0039 |
6.3 |
14 |
diel_exponential_vs_stationary | 0.058500 | -0.347 |
| Thaps_hclust_0083 |
|
|
0.0039 |
6.3 |
14 |
lowSi_TMEVA | 0.976000 | -0.129 |
| Thaps_hclust_0083 |
|
|
0.0039 |
6.3 |
14 |
highlight_arrays | 0.028100 | -0.355 |
| Thaps_hclust_0083 |
|
|
0.0039 |
6.3 |
14 |
diel_light_vs_dark | 0.000485 | 1.36 |
| Thaps_hclust_0083 |
|
|
0.0039 |
6.3 |
14 |
lowFe_KTKB_Day3 | 0.375000 | 0.233 |
| Thaps_hclust_0083 |
|
|
0.0039 |
6.3 |
14 |
lowFe_KTKB_Day5 | 0.387000 | 0.188 |
| Thaps_hclust_0083 |
|
|
0.0039 |
6.3 |
14 |
BaP | 0.177000 | 0.313 |
| Thaps_hclust_0083 |
|
|
0.0039 |
6.3 |
14 |
exponential_vs_stationary_24highlight | 0.793000 | 0.0348 |
| Thaps_hclust_0083 |
|
|
0.0039 |
6.3 |
14 |
co2_elevated_stat_arrays | 0.361000 | -0.226 |
| Thaps_hclust_0083 |
|
|
0.0039 |
6.3 |
14 |
lowtemp_TMEVA | 0.873000 | -0.05 |
| Thaps_hclust_0083 |
|
|
0.0039 |
6.3 |
14 |
highpH_TMEVA | 0.000725 | -0.576 |
| Thaps_hclust_0083 |
|
|
0.0039 |
6.3 |
14 |
co2_elevated_expo_arrays | 0.139000 | 0.23 |
| Title | Cluster Plot | Dendrogram | e-value | e-value | e-value | Condition | Condition FDR | Condition Difference |
|---|---|---|---|---|---|---|---|---|
| Thaps_hclust_0082 |
 |
|
8.89825e-43 |
2e-27 |
1.3e-16 |
co2_elevated_expo_arrays | 0.001390 | 1.09 |
| Thaps_hclust_0082 |
|
|
8.89825e-43 |
2e-27 |
1.3e-16 |
lowFe_TMEVA | 0.452000 | 0.152 |
| Thaps_hclust_0082 |
|
|
8.89825e-43 |
2e-27 |
1.3e-16 |
exponential_vs_stationary_24light | 0.000581 | 2.11 |
| Thaps_hclust_0082 |
|
|
8.89825e-43 |
2e-27 |
1.3e-16 |
lowN_TMEVA | 0.001190 | -0.512 |
| Thaps_hclust_0082 |
|
|
8.89825e-43 |
2e-27 |
1.3e-16 |
diel_exponential_vs_stationary | 0.170000 | 0.116 |
| Thaps_hclust_0082 |
|
|
8.89825e-43 |
2e-27 |
1.3e-16 |
lowSi_TMEVA | 0.001350 | -1.03 |
| Thaps_hclust_0082 |
|
|
8.89825e-43 |
2e-27 |
1.3e-16 |
highlight_arrays | 0.000442 | -0.807 |
| Thaps_hclust_0082 |
|
|
8.89825e-43 |
2e-27 |
1.3e-16 |
diel_light_vs_dark | 0.000485 | 1.67 |
| Thaps_hclust_0082 |
|
|
8.89825e-43 |
2e-27 |
1.3e-16 |
lowFe_KTKB_Day3 | 0.000862 | 0.987 |
| Thaps_hclust_0082 |
|
|
8.89825e-43 |
2e-27 |
1.3e-16 |
lowFe_KTKB_Day5 | 0.001320 | 0.728 |
| Thaps_hclust_0082 |
|
|
8.89825e-43 |
2e-27 |
1.3e-16 |
BaP | 0.824000 | -0.0268 |
| Thaps_hclust_0082 |
|
|
8.89825e-43 |
2e-27 |
1.3e-16 |
exponential_vs_stationary_24highlight | 0.000526 | 0.226 |
| Thaps_hclust_0082 |
|
|
8.89825e-43 |
2e-27 |
1.3e-16 |
co2_elevated_stat_arrays | 0.046800 | 0.253 |
| Thaps_hclust_0082 |
|
|
8.89825e-43 |
2e-27 |
1.3e-16 |
lowtemp_TMEVA | 1.000000 | -0.000692 |
| Thaps_hclust_0082 |
|
|
8.89825e-43 |
2e-27 |
1.3e-16 |
highpH_TMEVA | 0.000725 | -0.879 |
| Title | Cluster Plot | Dendrogram | e-value | e-value | e-value | Condition | Condition FDR | Condition Difference |
|---|---|---|---|---|---|---|---|---|
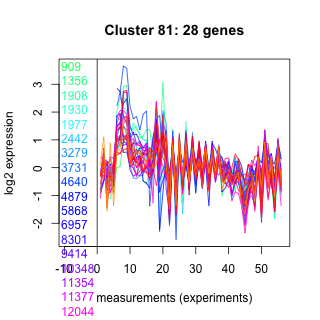
| Thaps_hclust_0081 |
 |
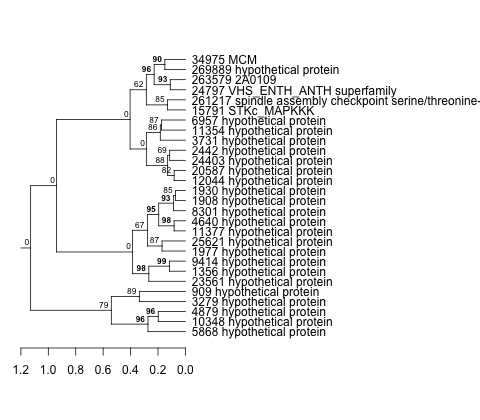 |
0.000000001 |
0.000000000027 |
0.28 |
highpH_TMEVA | 0.000725 | -0.438 |
| Thaps_hclust_0081 |
|
|
0.000000001 |
0.000000000027 |
0.28 |
co2_elevated_expo_arrays | 0.001390 | 0.536 |
| Thaps_hclust_0081 |
|
|
0.000000001 |
0.000000000027 |
0.28 |
lowFe_TMEVA | 0.750000 | 0.11 |
| Thaps_hclust_0081 |
|
|
0.000000001 |
0.000000000027 |
0.28 |
exponential_vs_stationary_24light | 0.000581 | 0.942 |
| Thaps_hclust_0081 |
|
|
0.000000001 |
0.000000000027 |
0.28 |
lowN_TMEVA | 0.099500 | -0.44 |
| Thaps_hclust_0081 |
|
|
0.000000001 |
0.000000000027 |
0.28 |
diel_exponential_vs_stationary | 0.124000 | -0.227 |
| Thaps_hclust_0081 |
|
|
0.000000001 |
0.000000000027 |
0.28 |
lowSi_TMEVA | 0.844000 | -0.213 |
| Thaps_hclust_0081 |
|
|
0.000000001 |
0.000000000027 |
0.28 |
highlight_arrays | 0.000442 | -0.462 |
| Thaps_hclust_0081 |
|
|
0.000000001 |
0.000000000027 |
0.28 |
diel_light_vs_dark | 0.000485 | 1.07 |
| Thaps_hclust_0081 |
|
|
0.000000001 |
0.000000000027 |
0.28 |
lowFe_KTKB_Day3 | 0.859000 | 0.0456 |
| Thaps_hclust_0081 |
|
|
0.000000001 |
0.000000000027 |
0.28 |
lowFe_KTKB_Day5 | 0.246000 | 0.2 |
| Thaps_hclust_0081 |
|
|
0.000000001 |
0.000000000027 |
0.28 |
BaP | 0.000370 | 0.649 |
| Thaps_hclust_0081 |
|
|
0.000000001 |
0.000000000027 |
0.28 |
exponential_vs_stationary_24highlight | 0.504000 | 0.0647 |
| Thaps_hclust_0081 |
|
|
0.000000001 |
0.000000000027 |
0.28 |
co2_elevated_stat_arrays | 0.483000 | 0.161 |
| Thaps_hclust_0081 |
|
|
0.000000001 |
0.000000000027 |
0.28 |
lowtemp_TMEVA | 0.078500 | -0.365 |