Hierarchical Clusters
Displaying 401 - 500 of 28001
| Title | Cluster Plot | Dendrogram | e-value | e-value | e-value | Condition | Condition FDR | Condition Difference |
|---|---|---|---|---|---|---|---|---|
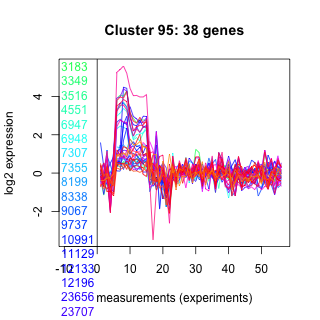
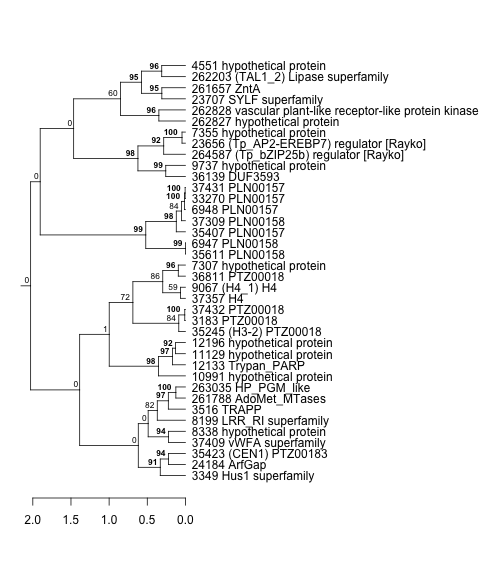
| Thaps_hclust_0095 |
 |
 |
5.3e-28 |
1.7e-25 |
1.6e-17 |
BaP | 0.183000 | -0.209 |
| Thaps_hclust_0095 |
|
|
5.3e-28 |
1.7e-25 |
1.6e-17 |
exponential_vs_stationary_24highlight | 0.263000 | 0.0886 |
| Thaps_hclust_0095 |
|
|
5.3e-28 |
1.7e-25 |
1.6e-17 |
co2_elevated_stat_arrays | 0.999000 | -0.000503 |
| Thaps_hclust_0095 |
|
|
5.3e-28 |
1.7e-25 |
1.6e-17 |
lowtemp_TMEVA | 0.599000 | 0.106 |
| Thaps_hclust_0095 |
|
|
5.3e-28 |
1.7e-25 |
1.6e-17 |
highpH_TMEVA | 0.722000 | -0.0542 |
| Thaps_hclust_0095 |
|
|
5.3e-28 |
1.7e-25 |
1.6e-17 |
co2_elevated_expo_arrays | 0.629000 | 0.101 |
| Thaps_hclust_0095 |
|
|
5.3e-28 |
1.7e-25 |
1.6e-17 |
lowFe_TMEVA | 0.356000 | -0.218 |
| Thaps_hclust_0095 |
|
|
5.3e-28 |
1.7e-25 |
1.6e-17 |
exponential_vs_stationary_24light | 0.650000 | 0.137 |
| Thaps_hclust_0095 |
|
|
5.3e-28 |
1.7e-25 |
1.6e-17 |
lowN_TMEVA | 0.894000 | 0.0437 |
| Thaps_hclust_0095 |
|
|
5.3e-28 |
1.7e-25 |
1.6e-17 |
diel_exponential_vs_stationary | 0.096000 | -0.207 |
| Thaps_hclust_0095 |
|
|
5.3e-28 |
1.7e-25 |
1.6e-17 |
lowSi_TMEVA | 0.007000 | -0.745 |
| Thaps_hclust_0095 |
|
|
5.3e-28 |
1.7e-25 |
1.6e-17 |
highlight_arrays | 0.389000 | -0.109 |
| Title | Cluster Plot | Dendrogram | e-value | e-value | e-value | Condition | Condition FDR | Condition Difference |
|---|---|---|---|---|---|---|---|---|
| Thaps_hclust_0069 |
 |
 |
1.2e-26 |
2.6e-24 |
2.4e-20 |
diel_light_vs_dark | 0.004510 | -0.384 |
| Thaps_hclust_0069 |
|
|
1.2e-26 |
2.6e-24 |
2.4e-20 |
lowFe_KTKB_Day3 | 0.463000 | -0.129 |
| Thaps_hclust_0069 |
|
|
1.2e-26 |
2.6e-24 |
2.4e-20 |
lowFe_KTKB_Day5 | 0.059800 | -0.251 |
| Thaps_hclust_0069 |
|
|
1.2e-26 |
2.6e-24 |
2.4e-20 |
BaP | 0.492000 | -0.111 |
| Thaps_hclust_0069 |
|
|
1.2e-26 |
2.6e-24 |
2.4e-20 |
exponential_vs_stationary_24highlight | 0.000526 | 0.306 |
| Thaps_hclust_0069 |
|
|
1.2e-26 |
2.6e-24 |
2.4e-20 |
co2_elevated_stat_arrays | 0.000658 | 0.711 |
| Thaps_hclust_0069 |
|
|
1.2e-26 |
2.6e-24 |
2.4e-20 |
lowtemp_TMEVA | 0.041200 | -0.347 |
| Thaps_hclust_0069 |
|
|
1.2e-26 |
2.6e-24 |
2.4e-20 |
highpH_TMEVA | 0.000725 | -0.819 |
| Thaps_hclust_0069 |
|
|
1.2e-26 |
2.6e-24 |
2.4e-20 |
co2_elevated_expo_arrays | 0.660000 | 0.0935 |
| Thaps_hclust_0069 |
|
|
1.2e-26 |
2.6e-24 |
2.4e-20 |
lowFe_TMEVA | 0.001040 | -0.729 |
| Thaps_hclust_0069 |
|
|
1.2e-26 |
2.6e-24 |
2.4e-20 |
exponential_vs_stationary_24light | 0.000581 | 2.1 |
| Thaps_hclust_0069 |
|
|
1.2e-26 |
2.6e-24 |
2.4e-20 |
lowN_TMEVA | 0.004000 | -0.621 |
| Thaps_hclust_0069 |
|
|
1.2e-26 |
2.6e-24 |
2.4e-20 |
diel_exponential_vs_stationary | 0.000602 | 1.82 |
| Thaps_hclust_0069 |
|
|
1.2e-26 |
2.6e-24 |
2.4e-20 |
lowSi_TMEVA | 0.296000 | -0.408 |
| Thaps_hclust_0069 |
|
|
1.2e-26 |
2.6e-24 |
2.4e-20 |
highlight_arrays | 0.000442 | -1.38 |
| Title | Cluster Plot | Dendrogram | e-value | e-value | e-value | Condition | Condition FDR | Condition Difference |
|---|---|---|---|---|---|---|---|---|
| Thaps_hclust_0022 |
 |
|
1.9e-31 |
2.4e-22 |
6.4e-20 |
diel_light_vs_dark | 0.000485 | -0.451 |
| Thaps_hclust_0022 |
|
|
1.9e-31 |
2.4e-22 |
6.4e-20 |
lowFe_KTKB_Day3 | 0.049500 | 0.245 |
| Thaps_hclust_0022 |
|
|
1.9e-31 |
2.4e-22 |
6.4e-20 |
lowFe_KTKB_Day5 | 0.001320 | -0.682 |
| Thaps_hclust_0022 |
|
|
1.9e-31 |
2.4e-22 |
6.4e-20 |
BaP | 0.000370 | -0.734 |
| Thaps_hclust_0022 |
|
|
1.9e-31 |
2.4e-22 |
6.4e-20 |
exponential_vs_stationary_24highlight | 0.000526 | 0.356 |
| Thaps_hclust_0022 |
|
|
1.9e-31 |
2.4e-22 |
6.4e-20 |
co2_elevated_stat_arrays | 0.392000 | 0.164 |
| Thaps_hclust_0022 |
|
|
1.9e-31 |
2.4e-22 |
6.4e-20 |
lowtemp_TMEVA | 0.000735 | -3.34 |
| Thaps_hclust_0022 |
|
|
1.9e-31 |
2.4e-22 |
6.4e-20 |
highpH_TMEVA | 0.000725 | -0.62 |
| Thaps_hclust_0022 |
|
|
1.9e-31 |
2.4e-22 |
6.4e-20 |
co2_elevated_expo_arrays | 0.001390 | -0.333 |
| Thaps_hclust_0022 |
|
|
1.9e-31 |
2.4e-22 |
6.4e-20 |
lowFe_TMEVA | 0.001040 | -2.14 |
| Thaps_hclust_0022 |
|
|
1.9e-31 |
2.4e-22 |
6.4e-20 |
exponential_vs_stationary_24light | 0.000581 | 3.47 |
| Thaps_hclust_0022 |
|
|
1.9e-31 |
2.4e-22 |
6.4e-20 |
lowN_TMEVA | 0.001190 | -4.56 |
| Thaps_hclust_0022 |
|
|
1.9e-31 |
2.4e-22 |
6.4e-20 |
diel_exponential_vs_stationary | 0.000602 | 3.06 |
| Thaps_hclust_0022 |
|
|
1.9e-31 |
2.4e-22 |
6.4e-20 |
lowSi_TMEVA | 0.001350 | -4.7 |
| Thaps_hclust_0022 |
|
|
1.9e-31 |
2.4e-22 |
6.4e-20 |
highlight_arrays | 0.000442 | -1.57 |
| Title | Cluster Plot | Dendrogram | e-value | e-value | e-value | Condition | Condition FDR | Condition Difference |
|---|---|---|---|---|---|---|---|---|
| Thaps_hclust_0260 |
 |
 |
1.6e-36 |
9.1e-22 |
8.6e-22 |
diel_light_vs_dark | 0.646000 | -0.155 |
| Thaps_hclust_0260 |
|
|
1.6e-36 |
9.1e-22 |
8.6e-22 |
lowFe_KTKB_Day3 | 0.315000 | -0.323 |
| Thaps_hclust_0260 |
|
|
1.6e-36 |
9.1e-22 |
8.6e-22 |
lowFe_KTKB_Day5 | 0.284000 | -0.287 |
| Thaps_hclust_0260 |
|
|
1.6e-36 |
9.1e-22 |
8.6e-22 |
BaP | 0.087500 | 0.487 |
| Thaps_hclust_0260 |
|
|
1.6e-36 |
9.1e-22 |
8.6e-22 |
exponential_vs_stationary_24highlight | 0.000926 | 0.541 |
| Thaps_hclust_0260 |
|
|
1.6e-36 |
9.1e-22 |
8.6e-22 |
co2_elevated_stat_arrays | 0.011200 | 0.673 |
| Thaps_hclust_0260 |
|
|
1.6e-36 |
9.1e-22 |
8.6e-22 |
lowtemp_TMEVA | 0.105000 | -0.565 |
| Thaps_hclust_0260 |
|
|
1.6e-36 |
9.1e-22 |
8.6e-22 |
highpH_TMEVA | 0.111000 | -0.328 |
| Thaps_hclust_0260 |
|
|
1.6e-36 |
9.1e-22 |
8.6e-22 |
co2_elevated_expo_arrays | 0.306000 | 0.216 |
| Thaps_hclust_0260 |
|
|
1.6e-36 |
9.1e-22 |
8.6e-22 |
lowFe_TMEVA | 0.738000 | -0.135 |
| Thaps_hclust_0260 |
|
|
1.6e-36 |
9.1e-22 |
8.6e-22 |
exponential_vs_stationary_24light | 0.138000 | -0.591 |
| Thaps_hclust_0260 |
|
|
1.6e-36 |
9.1e-22 |
8.6e-22 |
lowN_TMEVA | 0.250000 | -0.478 |
| Thaps_hclust_0260 |
|
|
1.6e-36 |
9.1e-22 |
8.6e-22 |
diel_exponential_vs_stationary | 0.911000 | -0.035 |
| Thaps_hclust_0260 |
|
|
1.6e-36 |
9.1e-22 |
8.6e-22 |
lowSi_TMEVA | 1.000000 | -0.0448 |
| Thaps_hclust_0260 |
|
|
1.6e-36 |
9.1e-22 |
8.6e-22 |
highlight_arrays | 0.000442 | -0.766 |
| Title | Cluster Plot | Dendrogram | e-value | e-value | e-value | Condition | Condition FDR | Condition Difference |
|---|---|---|---|---|---|---|---|---|
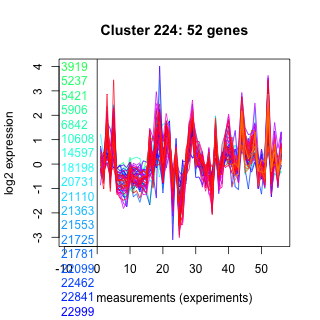
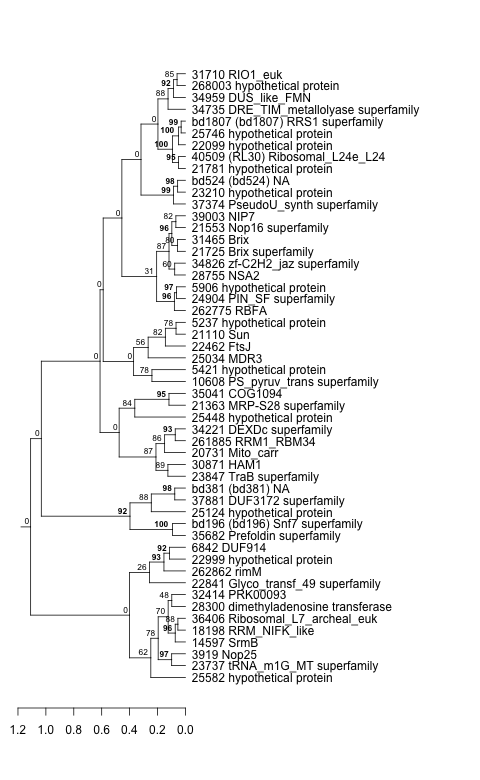
| Thaps_hclust_0224 |
 |
 |
9.3e-28 |
1.9e-21 |
0.046 |
diel_light_vs_dark | 0.000485 | -0.635 |
| Thaps_hclust_0224 |
|
|
9.3e-28 |
1.9e-21 |
0.046 |
lowFe_KTKB_Day3 | 0.051000 | 0.267 |
| Thaps_hclust_0224 |
|
|
9.3e-28 |
1.9e-21 |
0.046 |
lowFe_KTKB_Day5 | 0.864000 | -0.0242 |
| Thaps_hclust_0224 |
|
|
9.3e-28 |
1.9e-21 |
0.046 |
BaP | 0.000370 | 0.783 |
| Thaps_hclust_0224 |
|
|
9.3e-28 |
1.9e-21 |
0.046 |
exponential_vs_stationary_24highlight | 0.000526 | -0.402 |
| Thaps_hclust_0224 |
|
|
9.3e-28 |
1.9e-21 |
0.046 |
co2_elevated_stat_arrays | 0.000658 | 1.17 |
| Thaps_hclust_0224 |
|
|
9.3e-28 |
1.9e-21 |
0.046 |
lowtemp_TMEVA | 0.000735 | 1.18 |
| Thaps_hclust_0224 |
|
|
9.3e-28 |
1.9e-21 |
0.046 |
highpH_TMEVA | 0.686000 | 0.0546 |
| Thaps_hclust_0224 |
|
|
9.3e-28 |
1.9e-21 |
0.046 |
co2_elevated_expo_arrays | 0.683000 | -0.0892 |
| Thaps_hclust_0224 |
|
|
9.3e-28 |
1.9e-21 |
0.046 |
lowFe_TMEVA | 0.382000 | -0.194 |
| Thaps_hclust_0224 |
|
|
9.3e-28 |
1.9e-21 |
0.046 |
exponential_vs_stationary_24light | 0.000581 | -1.22 |
| Thaps_hclust_0224 |
|
|
9.3e-28 |
1.9e-21 |
0.046 |
lowN_TMEVA | 0.001190 | 1.15 |
| Thaps_hclust_0224 |
|
|
9.3e-28 |
1.9e-21 |
0.046 |
diel_exponential_vs_stationary | 0.000602 | -0.76 |
| Thaps_hclust_0224 |
|
|
9.3e-28 |
1.9e-21 |
0.046 |
lowSi_TMEVA | 1.000000 | -0.0215 |
| Thaps_hclust_0224 |
|
|
9.3e-28 |
1.9e-21 |
0.046 |
highlight_arrays | 0.000442 | 0.362 |
| Title | Cluster Plot | Dendrogram | e-value | e-value | e-value | Condition | Condition FDR | Condition Difference |
|---|---|---|---|---|---|---|---|---|
| Thaps_hclust_0015 |
 |
|
2.5e-25 |
7.4e-21 |
0.0000000011 |
diel_light_vs_dark | 0.000485 | -1.64 |
| Thaps_hclust_0015 |
|
|
2.5e-25 |
7.4e-21 |
0.0000000011 |
lowFe_KTKB_Day3 | 0.000862 | 0.949 |
| Thaps_hclust_0015 |
|
|
2.5e-25 |
7.4e-21 |
0.0000000011 |
lowFe_KTKB_Day5 | 0.249000 | 0.128 |
| Thaps_hclust_0015 |
|
|
2.5e-25 |
7.4e-21 |
0.0000000011 |
BaP | 0.000370 | -0.519 |
| Thaps_hclust_0015 |
|
|
2.5e-25 |
7.4e-21 |
0.0000000011 |
exponential_vs_stationary_24highlight | 0.000526 | 0.508 |
| Thaps_hclust_0015 |
|
|
2.5e-25 |
7.4e-21 |
0.0000000011 |
co2_elevated_stat_arrays | 0.125000 | 0.239 |
| Thaps_hclust_0015 |
|
|
2.5e-25 |
7.4e-21 |
0.0000000011 |
lowtemp_TMEVA | 0.012000 | 0.362 |
| Thaps_hclust_0015 |
|
|
2.5e-25 |
7.4e-21 |
0.0000000011 |
highpH_TMEVA | 0.000725 | -0.331 |
| Thaps_hclust_0015 |
|
|
2.5e-25 |
7.4e-21 |
0.0000000011 |
co2_elevated_expo_arrays | 0.250000 | 0.129 |
| Thaps_hclust_0015 |
|
|
2.5e-25 |
7.4e-21 |
0.0000000011 |
lowFe_TMEVA | 0.001040 | -1.31 |
| Thaps_hclust_0015 |
|
|
2.5e-25 |
7.4e-21 |
0.0000000011 |
exponential_vs_stationary_24light | 0.000581 | 2.9 |
| Thaps_hclust_0015 |
|
|
2.5e-25 |
7.4e-21 |
0.0000000011 |
lowN_TMEVA | 0.001190 | -2.83 |
| Thaps_hclust_0015 |
|
|
2.5e-25 |
7.4e-21 |
0.0000000011 |
diel_exponential_vs_stationary | 0.000602 | 1.97 |
| Thaps_hclust_0015 |
|
|
2.5e-25 |
7.4e-21 |
0.0000000011 |
lowSi_TMEVA | 0.001350 | -2.9 |
| Thaps_hclust_0015 |
|
|
2.5e-25 |
7.4e-21 |
0.0000000011 |
highlight_arrays | 0.000442 | -1.29 |
| Title | Cluster Plot | Dendrogram | e-value | e-value | e-value | Condition | Condition FDR | Condition Difference |
|---|---|---|---|---|---|---|---|---|
| Thaps_hclust_0024 |
 |
|
2.8e-19 |
1.2e-20 |
0.00000000000043 |
diel_light_vs_dark | 0.000485 | -0.457 |
| Thaps_hclust_0024 |
|
|
2.8e-19 |
1.2e-20 |
0.00000000000043 |
lowFe_KTKB_Day3 | 0.000862 | 1.17 |
| Thaps_hclust_0024 |
|
|
2.8e-19 |
1.2e-20 |
0.00000000000043 |
lowFe_KTKB_Day5 | 0.358000 | 0.101 |
| Thaps_hclust_0024 |
|
|
2.8e-19 |
1.2e-20 |
0.00000000000043 |
BaP | 0.057600 | -0.21 |
| Thaps_hclust_0024 |
|
|
2.8e-19 |
1.2e-20 |
0.00000000000043 |
exponential_vs_stationary_24highlight | 0.000526 | 0.184 |
| Thaps_hclust_0024 |
|
|
2.8e-19 |
1.2e-20 |
0.00000000000043 |
co2_elevated_stat_arrays | 0.002130 | 0.376 |
| Thaps_hclust_0024 |
|
|
2.8e-19 |
1.2e-20 |
0.00000000000043 |
lowtemp_TMEVA | 0.000735 | -0.991 |
| Thaps_hclust_0024 |
|
|
2.8e-19 |
1.2e-20 |
0.00000000000043 |
highpH_TMEVA | 0.008490 | -0.223 |
| Thaps_hclust_0024 |
|
|
2.8e-19 |
1.2e-20 |
0.00000000000043 |
co2_elevated_expo_arrays | 0.934000 | -0.0451 |
| Thaps_hclust_0024 |
|
|
2.8e-19 |
1.2e-20 |
0.00000000000043 |
lowFe_TMEVA | 0.001040 | -1.22 |
| Thaps_hclust_0024 |
|
|
2.8e-19 |
1.2e-20 |
0.00000000000043 |
exponential_vs_stationary_24light | 0.000581 | 2.13 |
| Thaps_hclust_0024 |
|
|
2.8e-19 |
1.2e-20 |
0.00000000000043 |
lowN_TMEVA | 0.001190 | -1.66 |
| Thaps_hclust_0024 |
|
|
2.8e-19 |
1.2e-20 |
0.00000000000043 |
diel_exponential_vs_stationary | 0.000602 | 1.69 |