Thaps_bicluster_0128 Residual: 0.43
Thalassiosira pseudonana
| Title | Residual | Model version | Organism |
|---|---|---|---|
| Thaps_bicluster_0128 | 0.43 | Thalassiosira pseudonana |
" class="views-fluidgrid-wrapper clear-block">
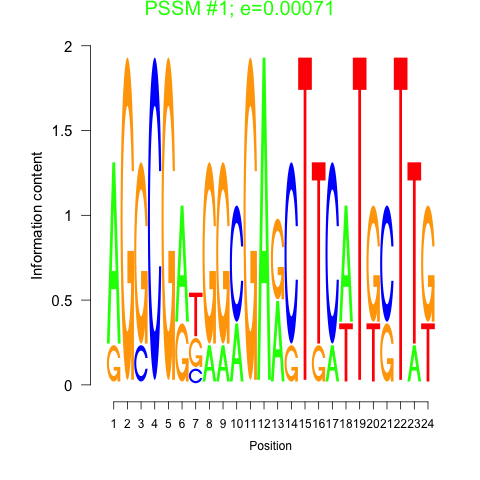
Motif 1 
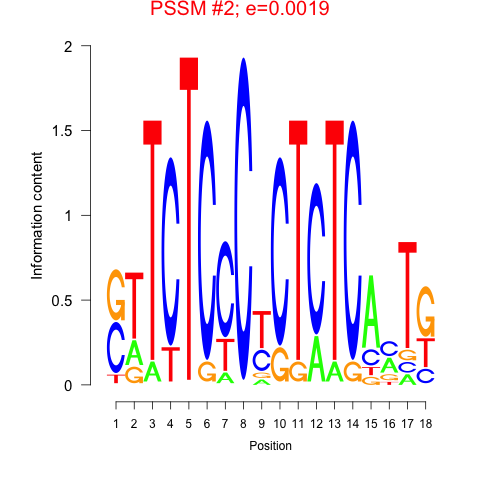
Motif 2 
Displaying 1 - 24 of 24
" class="views-fluidgrid-wrapper clear-block">
12053 hypothetical protein
12070 (NDK1) NDPk_I
18536 Chloroa_b-bind
20189 hypothetical protein
20807 hypothetical protein
21585 Zip superfamily
24382 PseudoU_synth_RluCD_like
24558 hypothetical protein
25610 COG2335
25839 hypothetical protein
263935 PAS_9
2684 hypothetical protein
270220 (FCP_1) hypothetical protein
2769 Mito_carr
3428 hypothetical protein
3463 hypothetical protein
36605 SufE superfamily
37183 RimI
38775 GT1_like_2
43128 hypothetical protein
4376 (PRK1) PRK
6323 hypothetical protein
7863 hypothetical protein
9252 hypothetical protein
| GO ID | Go Term | p-value | q-value | Cluster |
|---|---|---|---|---|
| GO:0009058 | biosynthesis | 0.00778924 | 1 | Thaps_bicluster_0128 |
| GO:0006241 | CTP biosynthesis | 0.017248 | 1 | Thaps_bicluster_0128 |
| GO:0006183 | GTP biosynthesis | 0.017248 | 1 | Thaps_bicluster_0128 |
| GO:0006228 | UTP biosynthesis | 0.017248 | 1 | Thaps_bicluster_0128 |
| GO:0030001 | metal ion transport | 0.0318146 | 1 | Thaps_bicluster_0128 |
| GO:0007155 | cell adhesion | 0.0720184 | 1 | Thaps_bicluster_0128 |
| GO:0007165 | signal transduction | 0.0949469 | 1 | Thaps_bicluster_0128 |
| GO:0009765 | photosynthesis light harvesting | 0.0949469 | 1 | Thaps_bicluster_0128 |
| GO:0005975 | carbohydrate metabolism | 0.171169 | 1 | Thaps_bicluster_0128 |
| GO:0006810 | transport | 0.372449 | 1 | Thaps_bicluster_0128 |
Comments