Thaps_bicluster_0145 Residual: 0.29
Thalassiosira pseudonana
| Title | Residual | Model version | Organism |
|---|---|---|---|
| Thaps_bicluster_0145 | 0.29 | Thalassiosira pseudonana |
" class="views-fluidgrid-wrapper clear-block">
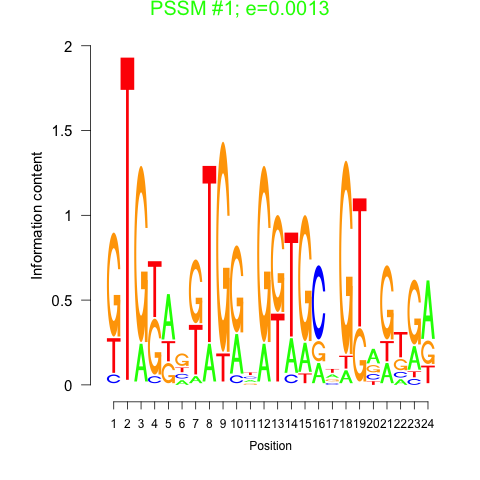
Motif 1 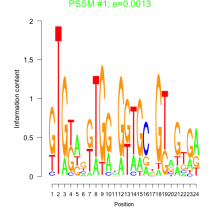
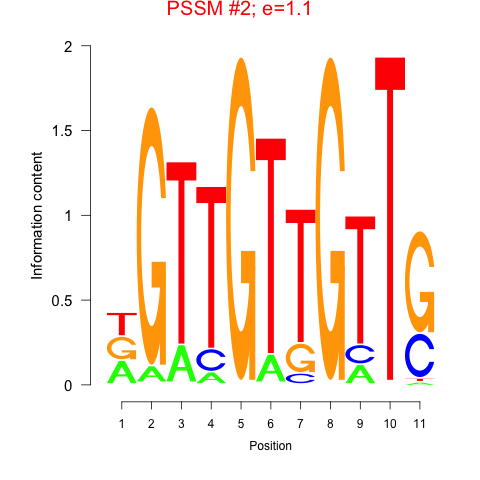
Motif 2 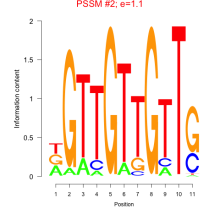
Displaying 1 - 28 of 28
" class="views-fluidgrid-wrapper clear-block">
11054 hypothetical protein
11655 hypothetical protein
11974 Rav1p_C superfamily
12090 hypothetical protein
13740 DUF221 superfamily
1527 hypothetical protein
18089 Thioredoxin_like superfamily
21130 hypothetical protein
21504 hypothetical protein
22862 hypothetical protein
23364 hypothetical protein
2632 hypothetical protein
269257 Peptidases_S8_Subtilisin_subset
3021 TAF6
3058 WD40 superfamily
3241 hypothetical protein
34672 Sm_E
37137 HTH_XRE
3848 BKR_SDR_c
5664 hypothetical protein
5672 HA
5927 UBQ superfamily
5944 hypothetical protein
7376 hypothetical protein
7423 hypothetical protein
8692 hypothetical protein
8779 Ras_like_GTPase superfamily
9727 DUF4200
| GO ID | Go Term | p-value | q-value | Cluster |
|---|---|---|---|---|
| GO:0007264 | small GTPase mediated signal transduction | 0.061562 | 1 | Thaps_bicluster_0145 |
| GO:0051090 | regulation of transcription factor activity | 0.00186066 | 1 | Thaps_bicluster_0145 |
| GO:0006508 | proteolysis and peptidolysis | 0.424754 | 1 | Thaps_bicluster_0145 |
| GO:0015031 | protein transport | 0.0772831 | 1 | Thaps_bicluster_0145 |
| GO:0006397 | mRNA processing | 0.0402303 | 1 | Thaps_bicluster_0145 |
| GO:0008152 | metabolism | 0.546944 | 1 | Thaps_bicluster_0145 |
| GO:0007242 | intracellular signaling cascade | 0.075548 | 1 | Thaps_bicluster_0145 |
| GO:0006886 | intracellular protein transport | 0.0961797 | 1 | Thaps_bicluster_0145 |
| GO:0006633 | fatty acid biosynthetic process | 0.00371824 | 1 | Thaps_bicluster_0145 |
Comments