Thaps_bicluster_0164 Residual: 0.39
Thalassiosira pseudonana
| Title | Residual | Model version | Organism |
|---|---|---|---|
| Thaps_bicluster_0164 | 0.39 | Thalassiosira pseudonana |
" class="views-fluidgrid-wrapper clear-block">
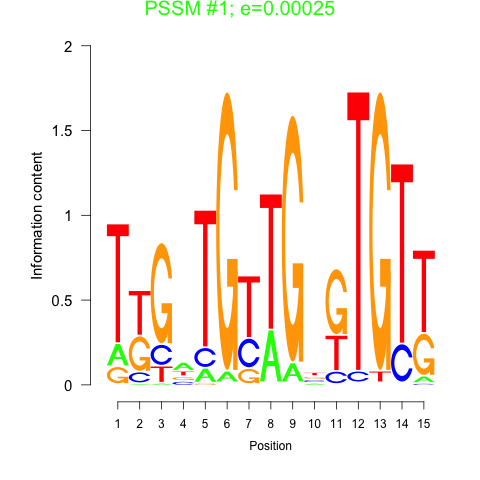
Motif 1 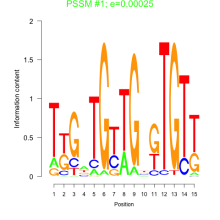
Motif 2 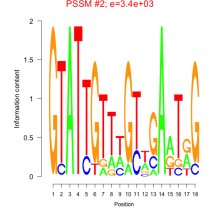

Displaying 1 - 25 of 25
" class="views-fluidgrid-wrapper clear-block">
10348 hypothetical protein
1743 Smc
18303 Ras_like_GTPase superfamily
24089 hypothetical protein
25104 hypothetical protein
260768 (HMCS1) PLN02577
262611 RabGAP-TBC
263415 rpa1
263928 vascular plant-like receptor protein kinase
2653 CH
269281 PKc_like superfamily
35197 CBS_pair_CAP-ED_DUF294_PBI_assoc
35372 ASF1_hist_chap
36137 BIM1
3731 hypothetical protein
37427 (cdk1) PLN00010
4214 hypothetical protein
4278 hypothetical protein
5047 hypothetical protein
6402 hypothetical protein
6586 hypothetical protein
8453 hypothetical protein
9351 hypothetical protein
9382 hypothetical protein
9851 Smc
| GO ID | Go Term | p-value | q-value | Cluster |
|---|---|---|---|---|
| GO:0051276 | chromosome organization and biogenesis | 0.0000239 | 0.0657675 | Thaps_bicluster_0164 |
| GO:0006084 | acetyl-CoA metabolism | 0.00165392 | 1 | Thaps_bicluster_0164 |
| GO:0007049 | cell cycle | 0.0115273 | 1 | Thaps_bicluster_0164 |
| GO:0007264 | small GTPase mediated signal transduction | 0.0549078 | 1 | Thaps_bicluster_0164 |
| GO:0006260 | DNA replication | 0.056482 | 1 | Thaps_bicluster_0164 |
| GO:0015031 | protein transport | 0.068993 | 1 | Thaps_bicluster_0164 |
| GO:0006468 | protein amino acid phosphorylation | 0.302703 | 1 | Thaps_bicluster_0164 |
Comments