Thaps_bicluster_0261 Residual: 0.35
Thalassiosira pseudonana
| Title | Residual | Model version | Organism |
|---|---|---|---|
| Thaps_bicluster_0261 | 0.35 | Thalassiosira pseudonana |
" class="views-fluidgrid-wrapper clear-block">
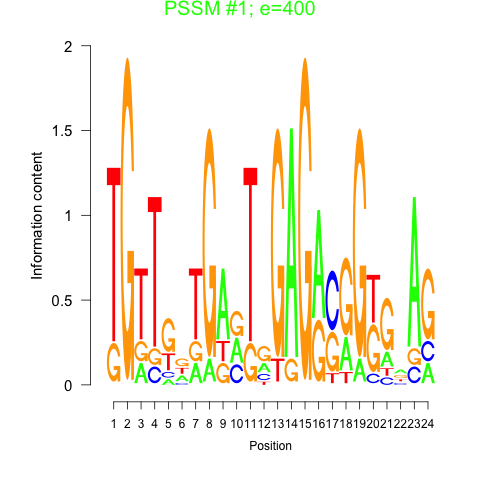
Motif 1 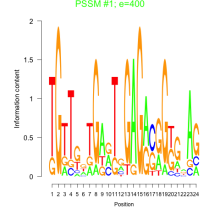
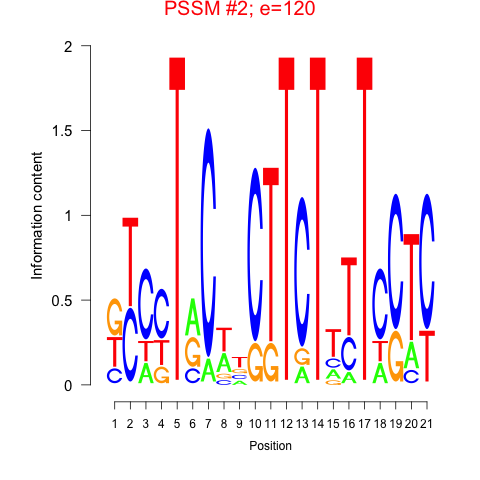
Motif 2 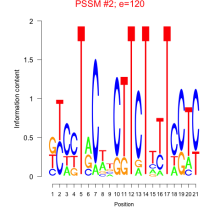
Displaying 1 - 25 of 25
" class="views-fluidgrid-wrapper clear-block">
10228 hypothetical protein
10889 hypothetical protein
11174 ENDO3c
11184 hypothetical protein
11195 hypothetical protein
1238 Glo_EDI_BRP_like
18091 Peptidase_S9 superfamily
23024 hypothetical protein
23082 hypothetical protein
24931 Thioredoxin_like superfamily
261394 Aldo_ket_red
31125 NADB_Rossmann superfamily
3204 hypothetical protein
33075 RimI
33219 Sdh5
33685 (MCM1) PRK09426
34211 Cytochrom_C superfamily
3661 MMCE
37584 Cupin_3
3914 hypothetical protein
4020 COG1741
8672 NADB_Rossmann superfamily
9405 Cytochrome_b_N superfamily
9412 hypothetical protein
9793 NADB_Rossmann superfamily
| GO ID | Go Term | p-value | q-value | Cluster |
|---|---|---|---|---|
| GO:0006118 | electron transport | 0.00487828 | 1 | Thaps_bicluster_0261 |
| GO:0008152 | metabolism | 0.0160137 | 1 | Thaps_bicluster_0261 |
| GO:0051341 | regulation of oxidoreductase activity | 0.0328341 | 1 | Thaps_bicluster_0261 |
Comments