motif_0045_1
Submitted by Anonymous (not verified) on Wed, 05/20/2015 - 14:16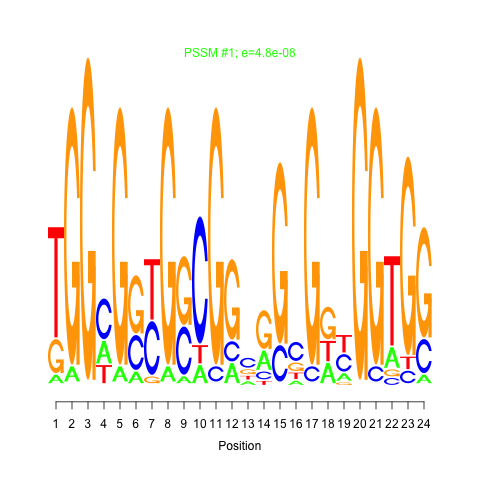
e.value:
0.000000048
Motif Bicluster:
Width:
24
Number of Sites:
1
Consensus:
TGGcGgtGgCGgcgGcGgnGGTGG
| Title | Model version | Residual | Score |
|---|---|---|---|
| bicluster_0045 | v02 | 0.14 | -17.77 |
|
Differential Expression Time:
2 hour 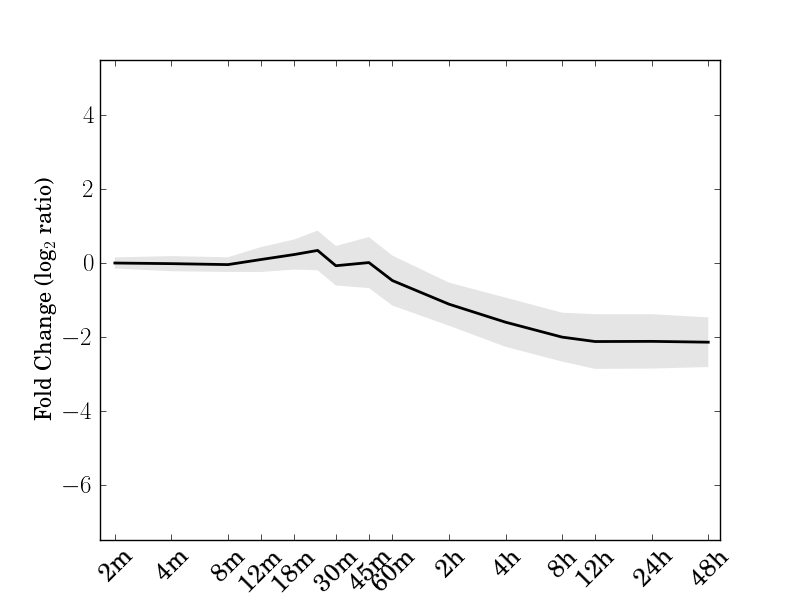 |
| Cre01.g033400.t1.2 Tim10/DDP family zinc finger protein | Cre01.g038400.t1.2 calreticulin 1b |
| Cre01.g041050.t1.1 amino acid transporter 1 | Cre05.g230850.t1.1 |
| Cre06.g276001.t1.1 | Cre06.g278750.t1.2 plant uncoupling mitochondrial protein 1 |
| Cre06.g280150.t1.2 Mog1/PsbP/DUF1795-like photosystem II reaction center PsbP family protein | Cre06.g298600.t1.2 zinc ion binding |
| Cre07.g335300.t1.2 fatty acid biosynthesis 1 | Cre08.g372950.t1.2 4-hydroxy-3-methylbut-2-enyl diphosphate reductase |
| Cre10.g438550.t1.2 Bacterial sec-independent translocation protein mttA/Hcf106 | Cre12.g534250.t1.2 |
| Cre14.g615000.t1.1 methionine sulfoxide reductase B 2 | Cre14.g616600.t1.2 FZO-like |
| Cre16.g672350.t1.1 breast cancer susceptibility1 | Cre17.g718100.t1.2 Sec14p-like phosphatidylinositol transfer family protein |
| Cre17.g726450.t1.2 | Cre24.g755197.t1.1 Rubredoxin-like superfamily protein |
motif_0045_1Submitted by Anonymous (not verified) on Wed, 05/20/2015 - 14:16e.value: 0.000000048 Motif Bicluster: Width: 24 Number of Sites: 1 Consensus: TGGcGgtGgCGgcgGcGgnGGTGG |
motif_0045_2Submitted by Anonymous (not verified) on Wed, 05/20/2015 - 14:16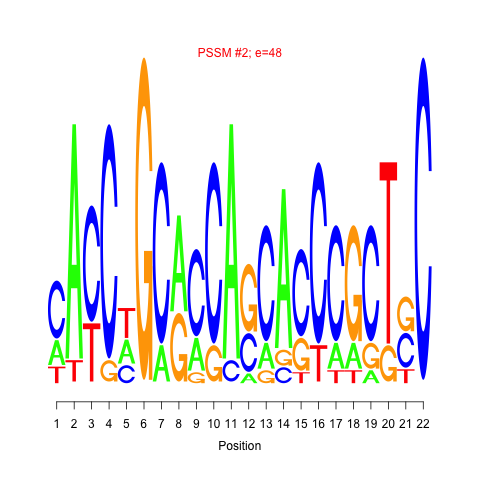 e.value: 48 Motif Bicluster: Width: 22 Number of Sites: 1 Consensus: cAcCtGCacCAgCAcCCGCTgC |
| Interaction | Weight | |
|---|---|---|
| down-regulates |
Cre03.g149350.t1.1Submitted by admin on Tue, 05/19/2015 - 15:51RWP-RK domain-containing protein |
0.029259 |
| down-regulates |
Cre10.g453500.t1.2Submitted by admin on Tue, 05/19/2015 - 15:51 |
0.063002 |
| down-regulates |
Cre12.g523000.t1.1Submitted by admin on Tue, 05/19/2015 - 15:51zinc finger protein 1 |
0.031015 |
| down-regulates |
Cre08.g375400.t1.1Submitted by admin on Tue, 05/19/2015 - 15:51KNOTTED-like homeobox of Arabidopsis thaliana 7 |
0.026038 |
| up-regulates |
Cre12.g534450.t1.1Submitted by admin on Tue, 05/19/2015 - 15:51SMAD/FHA domain-containing protein |
0.071797 |
| GO Terms | Descriptions |
|---|---|
| GO:0005509 | calcium ion binding |
Comments