motif_0075_1
Submitted by Anonymous (not verified) on Wed, 05/20/2015 - 14:16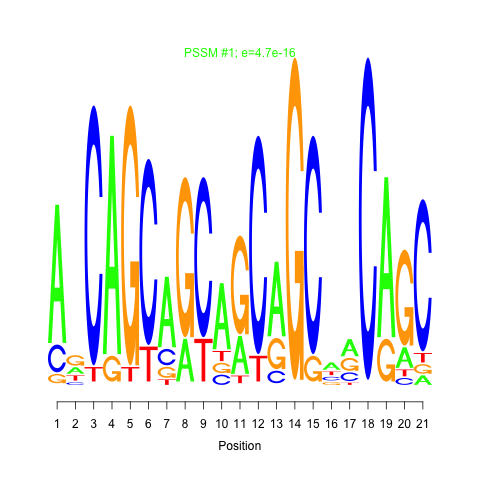
e.value:
4.7e-16
Motif Bicluster:
Width:
21
Number of Sites:
1
Consensus:
AgCAGCaGCagCaGCaaCAGC
| Title | Model version | Residual | Score |
|---|---|---|---|
| bicluster_0075 | v02 | 0.23 | -17.43 |
|
Differential Expression Time:
45 min 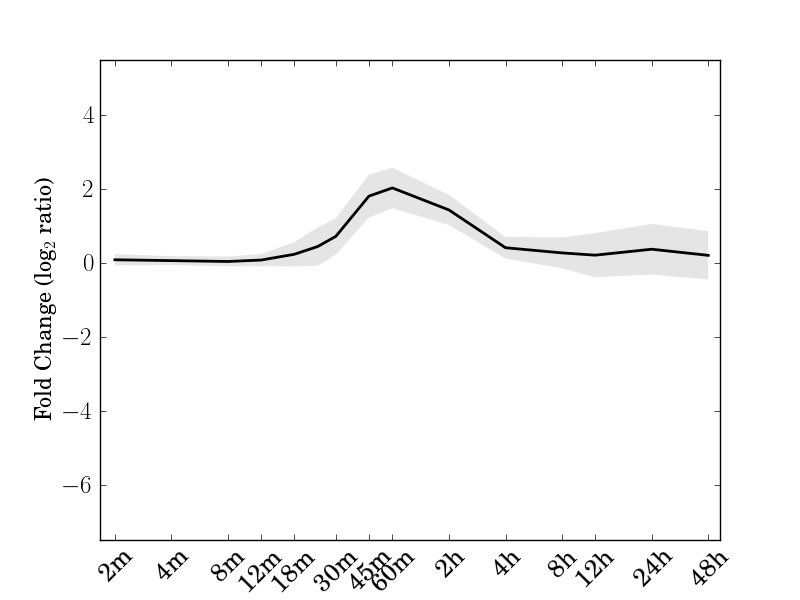 |
| Cre01.g012600.t1.1 Phosphoglucomutase | Cre01.g030850.t1.2 proteasome alpha subunit D2 |
| Cre02.g090000.t1.1 | Cre03.g182800.t1.1 alanine:glyoxylate aminotransferase 2 |
| Cre06.g260950.t1.2 EPS15 homology domain 1 | Cre06.g311100.t1.2 |
| Cre08.g358548.t1.1 | Cre08.g358574.t1.1 |
| Cre08.g385600.t2.1 | Cre09.g408051.t1.1 Mitochondrial transcription termination factor family protein |
| Cre12.g515050.t1.1 SET domain protein 14 | Cre12.g530550.t1.1 sphingosine kinase 1 |
| Cre13.g578750.t1.2 pyrimidine 1 | Cre13.g586000.t1.2 AMP-dependent synthetase and ligase family protein |
| Cre13.g588750.t1.1 | Cre14.g629050.t1.2 uclacyanin 1 |
| Cre14.g629960.t1.1 phytochelatin synthase 1 (PCS1) | Cre16.g669452.t1.1 |
| Cre16.g675350.t1.1 tripeptidyl peptidase ii | Cre17.g706450.t1.1 |
| Cre43.g760647.t1.1 |
motif_0075_1Submitted by Anonymous (not verified) on Wed, 05/20/2015 - 14:16e.value: 4.7e-16 Motif Bicluster: Width: 21 Number of Sites: 1 Consensus: AgCAGCaGCagCaGCaaCAGC |
motif_0075_2Submitted by Anonymous (not verified) on Wed, 05/20/2015 - 14:16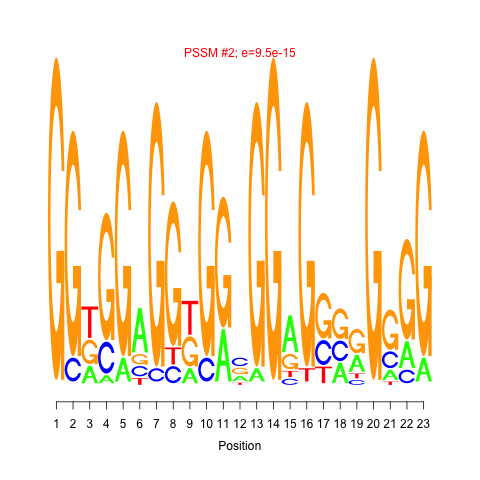 e.value: 0.0000000000000095 Motif Bicluster: Width: 23 Number of Sites: 1 Consensus: GGtGGaGGtGGnGGaGgggGgGG |
| Interaction | Weight | |
|---|---|---|
| GO Terms | Descriptions |
|---|---|
| Not available |
Comments