motif_0081_1
Submitted by Anonymous (not verified) on Wed, 05/20/2015 - 14:16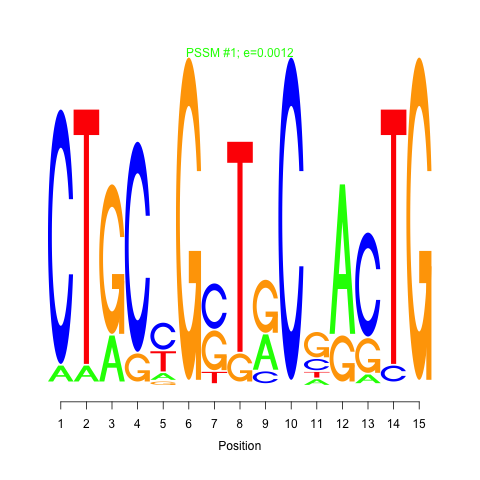
e.value:
0.0012
Motif Bicluster:
Width:
15
Number of Sites:
1
Consensus:
CTGCcGcTgCgACTG
| Title | Model version | Residual | Score |
|---|---|---|---|
| bicluster_0081 | v02 | 0.12 | -15.15 |
|
Differential Expression Time:
8 hour 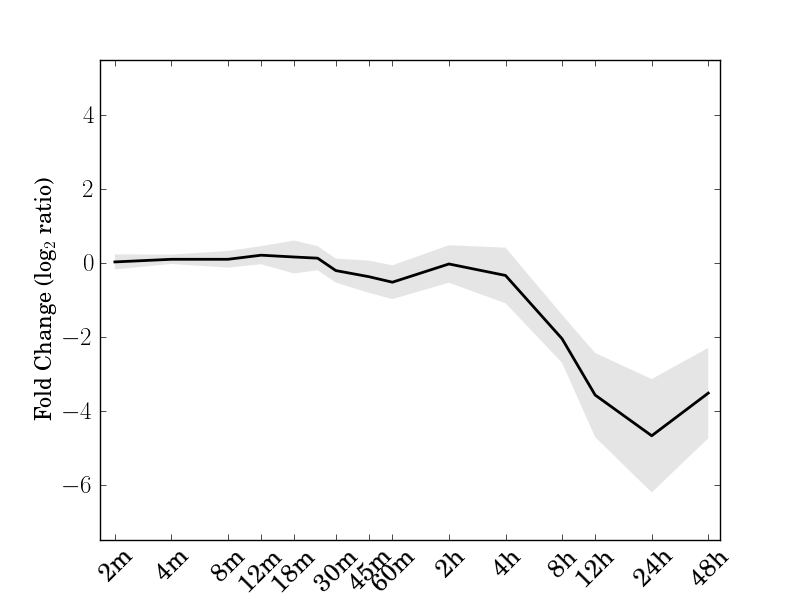 |
| Cre02.g082750.t1.2 photosystem II subunit X | Cre06.g270050.t1.1 |
| Cre06.g281450.t1.1 Scavenger receptor cysteine rich (SRCR) protein | Cre09.g396438.t1.1 |
| Cre09.g398250.t1.1 | Cre09.g398400.t1.2 Transient receptor potential ion channel protein |
| Cre09.g398450.t1.1 | Cre09.g399400.t2.1 Triacylglycerol lipase |
| Cre09.g404750.t1.1 Scavenger receptor cysteine rich (SRCR) protein | Cre10.g424100.t1.2 pyrophosphorylase 6 |
| Cre12.g486300.t1.2 photosystem I subunit l | Cre14.g613800.t1.1 |
| Cre14.g621650.t1.1 catalytics;transferases;[acyl-carrier-protein] S-malonyltransferases;binding | Cre16.g682900.t2.1 CLP protease proteolytic subunit 2 |
| Cre18.g748297.t1.1 | Cre18.g748347.t1.1 |
| Cre24.g755997.t1.1 Cell wall protein pherophorin-C18 |
motif_0081_1Submitted by Anonymous (not verified) on Wed, 05/20/2015 - 14:16e.value: 0.0012 Motif Bicluster: Width: 15 Number of Sites: 1 Consensus: CTGCcGcTgCgACTG |
motif_0081_2Submitted by Anonymous (not verified) on Wed, 05/20/2015 - 14:16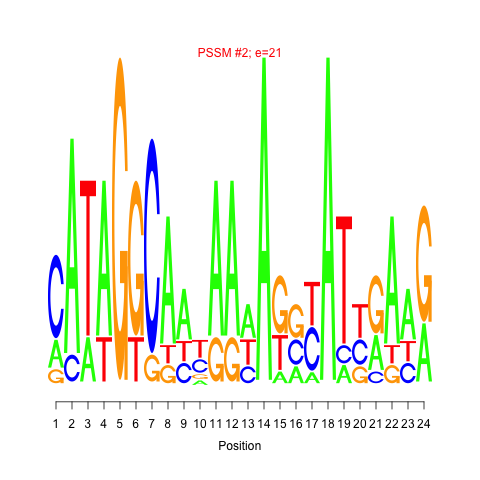 e.value: 21 Motif Bicluster: Width: 24 Number of Sites: 1 Consensus: cATAGGCAatAAaAggcATtgAag |
| Interaction | Weight | |
|---|---|---|
| GO Terms | Descriptions |
|---|---|
| GO:0015979 | photosynthesis |
Comments