motif_0142_1
Submitted by Anonymous (not verified) on Wed, 05/20/2015 - 14:16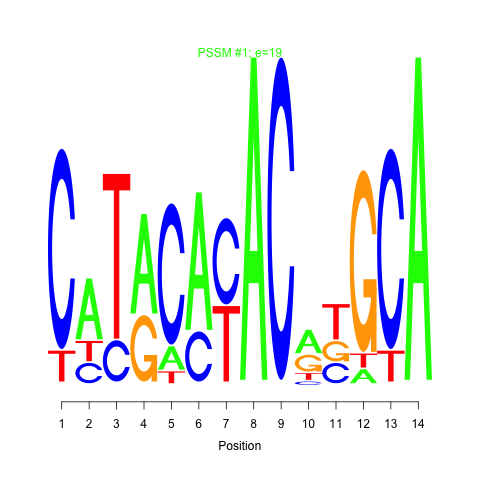
e.value:
19
Motif Bicluster:
Width:
14
Number of Sites:
1
Consensus:
CaTaCAcACatGCA
| Title | Model version | Residual | Score |
|---|---|---|---|
| bicluster_0142 | v02 | 0.11 | -12.63 |
|
Differential Expression Time:
2 hour 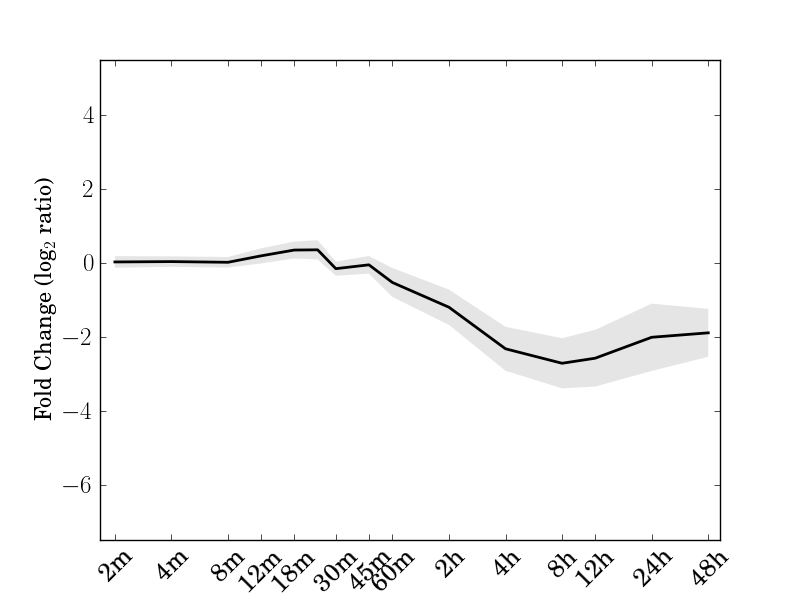 |
| Cre01.g014000.t1.2 | Cre01.g016900.t1.2 |
| Cre01.g069472.t1.1 Cysteinyl-tRNA synthetase, class Ia family protein | Cre06.g250200.t1.2 methionine adenosyltransferase 3 |
| Cre06.g278195.t1.1 | Cre08.g359350.t1.2 acetyl Co-enzyme a carboxylase biotin carboxylase subunit |
| Cre08.g362900.t1.1 Photosystem II reaction center PsbP family protein | Cre11.g467770.t1.1 Phosphoglycerate kinase family protein |
| Cre12.g483650.t1.2 Protein kinase superfamily protein | Cre12.g490350.t1.1 4-hydroxy-3-methylbut-2-enyl diphosphate synthase |
| Cre12.g498550.t1.1 magnesium-protoporphyrin IX methyltransferase | Cre13.g562850.t1.2 photosystem II reaction center PSB29 protein |
| Cre17.g701700.t2.1 Plant stearoyl-acyl-carrier-protein desaturase family protein | Cre17.g720050.t1.2 FtsH extracellular protease family |
| Cre17.g732250.t1.1 |
motif_0142_1Submitted by Anonymous (not verified) on Wed, 05/20/2015 - 14:16e.value: 19 Motif Bicluster: Width: 14 Number of Sites: 1 Consensus: CaTaCAcACatGCA |
motif_0142_2Submitted by Anonymous (not verified) on Wed, 05/20/2015 - 14:16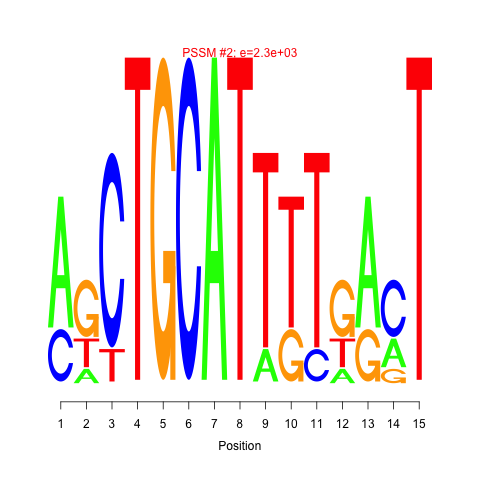 e.value: 2300 Motif Bicluster: Width: 15 Number of Sites: 1 Consensus: AgCTGCATTTTgAcT |
| Interaction | Weight | |
|---|---|---|
| down-regulates |
Cre03.g149350.t1.1Submitted by admin on Tue, 05/19/2015 - 15:51RWP-RK domain-containing protein |
0.048756 |
| down-regulates |
Cre12.g523000.t1.1Submitted by admin on Tue, 05/19/2015 - 15:51zinc finger protein 1 |
0.052134 |
| GO Terms | Descriptions |
|---|---|
| GO:0046429 | GO:0052592 | 4-hydroxy-3-methylbut-2-en-1-yl diphosph... | oxidoreductase activity, acting on CH or... |
Comments