motif_0143_1
Submitted by Anonymous (not verified) on Wed, 05/20/2015 - 14:16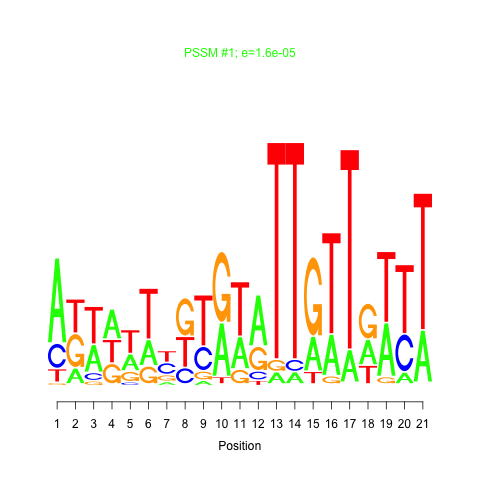
e.value:
0.000016
Motif Bicluster:
Width:
21
Number of Sites:
1
Consensus:
attattngtgtaTTgtTgttT
| Title | Model version | Residual | Score |
|---|---|---|---|
| bicluster_0143 | v02 | 0.23 | -15.74 |
|
Differential Expression Time:
24 min 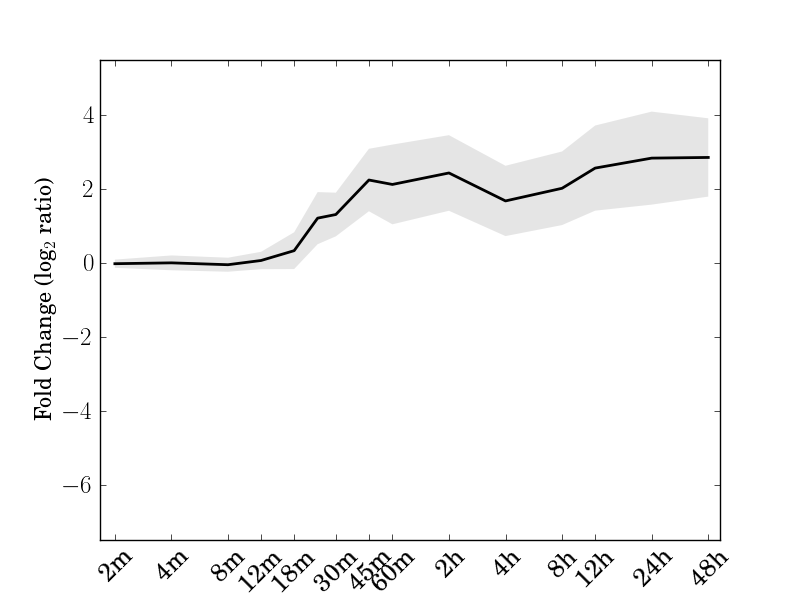 |
| Cre01.g012750.t1.1 gated outwardly-rectifying K+ channel | Cre01.g014400.t1.1 |
| Cre01.g034325.t1.1 | Cre01.g045903.t1.1 membrane bound O-acyl transferase (MBOAT) family protein |
| Cre02.g108650.t1.2 VH1-interacting kinase | Cre02.g115800.t1.1 Tryptophan RNA-binding attenuator protein-like |
| Cre03.g187400.t1.2 | Cre03.g199199.t1.1 |
| Cre04.g217350.t1.2 high affinity K+ transporter 5 | Cre06.g308500.t1.2 carbamoyl phosphate synthetase A |
| Cre07.g320700.t1.1 Adenylate/guanylate cyclase | Cre07.g347000.t1.1 Protein kinase superfamily protein with octicosapeptide/Phox/Bem1p domain |
| Cre07.g355050.t1.2 | Cre08.g384550.t1.1 |
| Cre10.g442600.t2.1 Xanthine/uracil permease family protein | Cre12.g485478.t1.1 |
| Cre12.g500200.t1.1 purple acid phosphatase 27 | Cre12.g518800.t2.1 Galactose oxidase/kelch repeat superfamily protein |
| Cre12.g537371.t1.2 | Cre12.g551700.t1.2 |
| Cre12.g557000.t1.2 Ubiquitin-like superfamily protein |
motif_0143_1Submitted by Anonymous (not verified) on Wed, 05/20/2015 - 14:16e.value: 0.000016 Motif Bicluster: Width: 21 Number of Sites: 1 Consensus: attattngtgtaTTgtTgttT |
motif_0143_2Submitted by Anonymous (not verified) on Wed, 05/20/2015 - 14:16 e.value: 0.0000000046 Motif Bicluster: Width: 24 Number of Sites: 1 Consensus: GcGgCGGCgGCaGcGGcggCgGCG |
| Interaction | Weight | |
|---|---|---|
| GO Terms | Descriptions |
|---|---|
| GO:0000045 | GO:0007033 | GO:0009267 | GO:0016236 | GO:0031667 | GO:0031669 | GO:0042594 | autophagic vacuole assembly | vacuole organization | cellular response to starvation | macroautophagy | response to nutrient levels | cellular response to nutrient levels | response to starvation |
Comments