motif_0152_1
Submitted by Anonymous (not verified) on Wed, 05/20/2015 - 14:16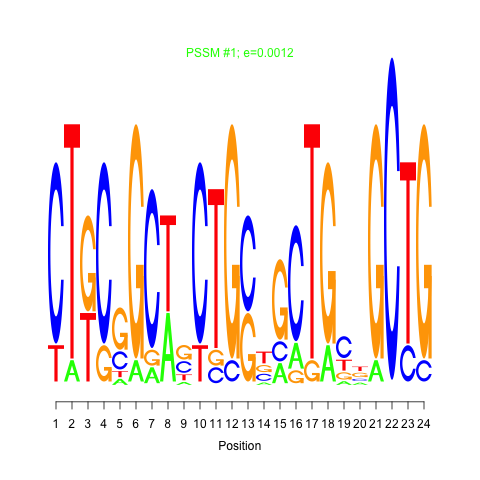
e.value:
0.0012
Motif Bicluster:
Width:
24
Number of Sites:
1
Consensus:
CTgCgGCtgCTGctgCTGcnGCTG
| Title | Model version | Residual | Score |
|---|---|---|---|
| bicluster_0152 | v02 | 0.15 | -15.05 |
|
Differential Expression Time:
18 min 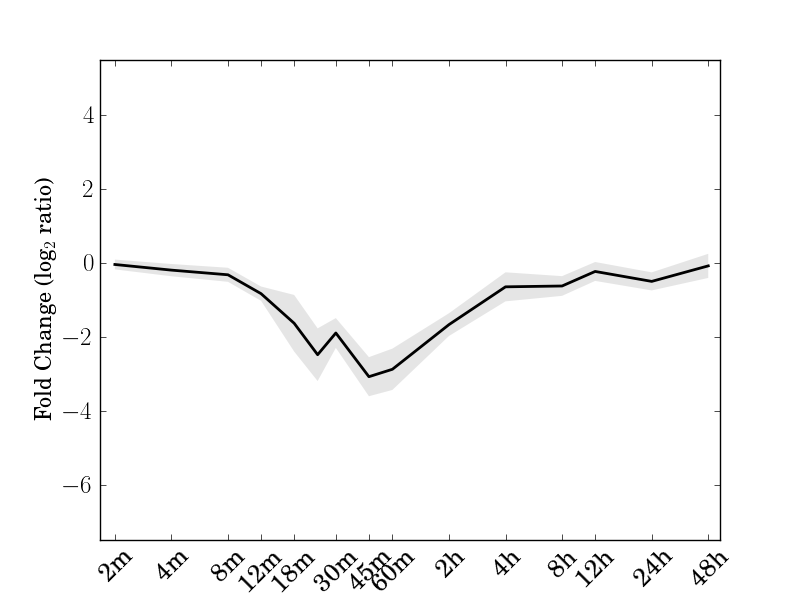 |
| Cre01.g036700.t1.2 NPK1-related protein kinase 2 | Cre02.g103050.t1.2 |
| Cre03.g197000.t1.2 Ribosomal RNA processing Brix domain protein | Cre03.g200543.t1.1 Mitochondrial substrate carrier family protein |
| Cre07.g315400.t1.1 P-loop containing nucleoside triphosphate hydrolases superfamily protein | Cre07.g347850.t1.1 |
| Cre07.g349300.t1.2 P-loop containing nucleoside triphosphate hydrolases superfamily protein | Cre09.g395880.t1.1 |
| Cre10.g466450.t1.1 chloroplast RNA-binding protein 29 | Cre10.g467100.t1.1 nuclear assembly factor 1 |
| Cre12.g526850.t1.2 P-loop containing nucleoside triphosphate hydrolases superfamily protein | Cre12.g558400.t1.1 |
| Cre14.g609551.t1.1 | Cre16.g685200.t1.1 nucleotide binding;nucleic acid binding;RNA binding |
motif_0152_1Submitted by Anonymous (not verified) on Wed, 05/20/2015 - 14:16e.value: 0.0012 Motif Bicluster: Width: 24 Number of Sites: 1 Consensus: CTgCgGCtgCTGctgCTGcnGCTG |
motif_0152_2Submitted by Anonymous (not verified) on Wed, 05/20/2015 - 14:16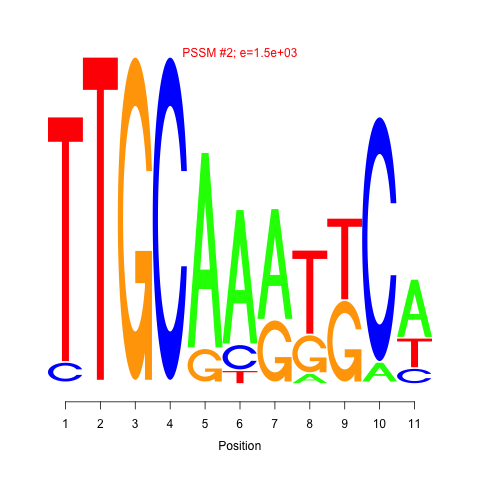 e.value: 1500 Motif Bicluster: Width: 11 Number of Sites: 1 Consensus: TTGCAAatgCa |
| Interaction | Weight | |
|---|---|---|
| GO Terms | Descriptions |
|---|---|
| GO:0008616 | GO:0046116 | queuosine biosynthetic process | queuosine metabolic process |
Comments