motif_0170_1
Submitted by Anonymous (not verified) on Wed, 05/20/2015 - 14:16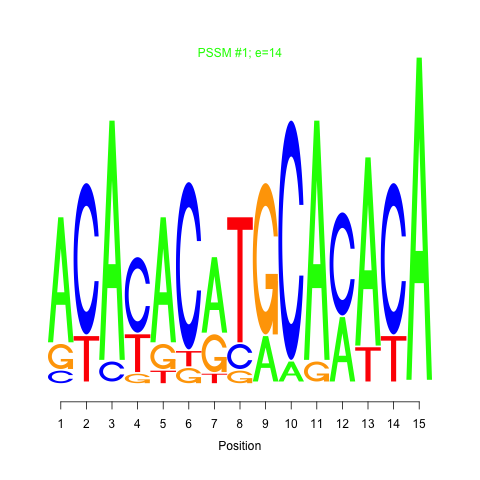
e.value:
14
Motif Bicluster:
Width:
15
Number of Sites:
1
Consensus:
ACAcACaTGCAcACA
| Title | Model version | Residual | Score |
|---|---|---|---|
| bicluster_0170 | v02 | 0.15 | -14.84 |
|
Differential Expression Time:
2 hour 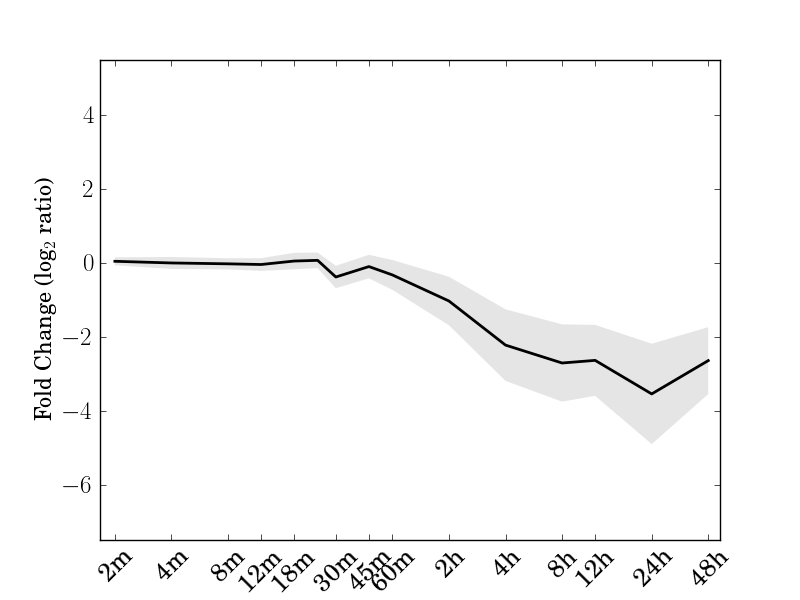 |
| Cre01.g050950.t1.2 Pyridine nucleotide-disulphide oxidoreductase family protein | Cre02.g081250.t1.2 plastid transcriptionally active 16 |
| Cre02.g093450.t1.2 Aldolase superfamily protein | Cre02.g111450.t1.2 Rhodanese/Cell cycle control phosphatase superfamily protein |
| Cre02.g145050.t1.2 4-(cytidine 5\'-phospho)-2-C-methyl-D-erithritol kinase | Cre03.g165100.t1.2 photsystem I subunit I |
| Cre06.g269050.t1.2 NAD(P)-binding Rossmann-fold superfamily protein | Cre06.g280150.t1.2 Mog1/PsbP/DUF1795-like photosystem II reaction center PsbP family protein |
| Cre07.g342150.t1.2 Glutamyl-tRNA reductase family protein | Cre07.g355600.t1.1 NADPH-dependent thioredoxin reductase A |
| Cre08.g377100.t1.2 adenosine kinase | Cre09.g396300.t1.2 Flavin containing amine oxidoreductase family |
| Cre09.g402219.t2.1 Low-CO2-inducible protein | Cre11.g467700.t1.1 Uroporphyrinogen decarboxylase |
| Cre12.g557050.t1.2 YGGT family protein | Cre14.g616600.t1.2 FZO-like |
| Cre16.g666050.t1.2 Saccharopine dehydrogenase |
motif_0170_1Submitted by Anonymous (not verified) on Wed, 05/20/2015 - 14:16e.value: 14 Motif Bicluster: Width: 15 Number of Sites: 1 Consensus: ACAcACaTGCAcACA |
motif_0170_2Submitted by Anonymous (not verified) on Wed, 05/20/2015 - 14:16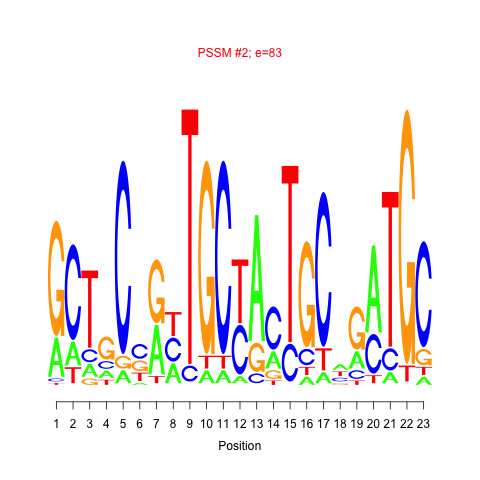 e.value: 83 Motif Bicluster: Width: 23 Number of Sites: 1 Consensus: GCTgCcgnTGCtAcTGCngaTGC |
| Interaction | Weight | |
|---|---|---|
| down-regulates |
Cre03.g149350.t1.1Submitted by admin on Tue, 05/19/2015 - 15:51RWP-RK domain-containing protein |
0.058626 |
| down-regulates |
Cre12.g523000.t1.1Submitted by admin on Tue, 05/19/2015 - 15:51zinc finger protein 1 |
0.033895 |
| GO Terms | Descriptions |
|---|---|
| GO:0009521 | GO:0034357 | GO:0009579 | GO:0044436 | photosystem | photosynthetic membrane | thylakoid | thylakoid part |
Comments