motif_0191_1
Submitted by Anonymous (not verified) on Wed, 05/20/2015 - 14:16
e.value:
0.00000014
Motif Bicluster:
Width:
20
Number of Sites:
1
Consensus:
CCaCCtCCaCCgCCgCCacC
| Title | Model version | Residual | Score |
|---|---|---|---|
| bicluster_0191 | v02 | 0.19 | -14.86 |
|
Differential Expression Time:
45 min 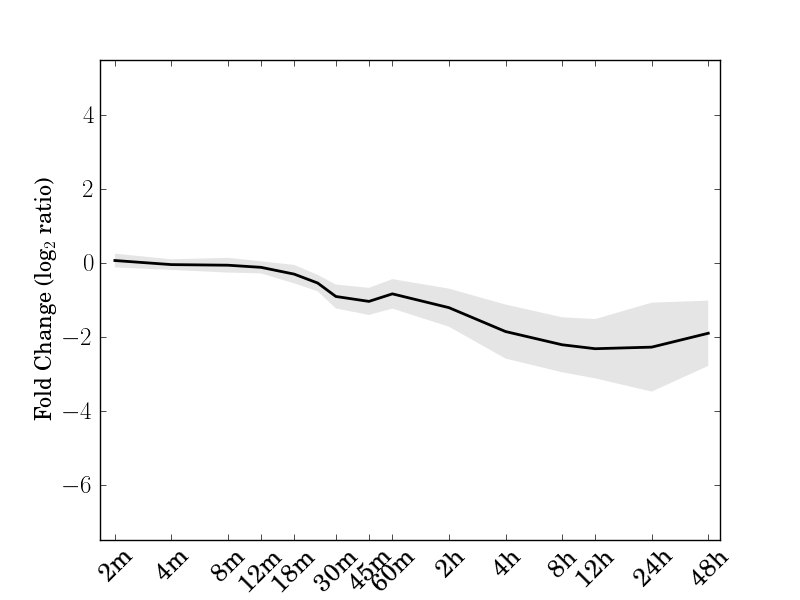 |
| Cre01.g013350.t1.2 | Cre02.g085900.t1.2 myo-inositol monophosphatase like 1 |
| Cre03.g170800.t1.2 | Cre03.g204350.t1.2 CLP protease R subunit 4 |
| Cre04.g231026.t1.1 chloroplast signal recognition particle component (CAO) | Cre06.g273050.t1.2 Arabinanase/levansucrase/invertase |
| Cre06.g278104.t1.1 | Cre06.g308600.t1.2 |
| Cre07.g331500.t1.1 ATP-dependent caseinolytic (Clp) protease/crotonase family protein | Cre09.g409100.t1.2 uroporphyrinogen-III synthase family protein |
| Cre11.g477850.t1.1 TUDOR-SN protein 2 | Cre12.g517100.t1.1 Chalcone-flavanone isomerase family protein |
| Cre12.g519050.t1.1 | Cre12.g542202.t1.1 Protein kinase superfamily protein |
| Cre12.g549852.t1.1 NAD(P)-binding Rossmann-fold superfamily protein | Cre13.g562900.t1.2 |
| Cre14.g619100.t1.2 CLP protease proteolytic subunit 1 | Cre15.g636750.t1.2 glutathione S-transferase F3 |
| Cre16.g651550.t1.2 Mitochondrial transcription termination factor family protein | Cre17.g712300.t1.1 |
| Cre17.g714900.t1.2 thylakoid lumenal 17.9 kDa protein, chloroplast |
motif_0191_1Submitted by Anonymous (not verified) on Wed, 05/20/2015 - 14:16e.value: 0.00000014 Motif Bicluster: Width: 20 Number of Sites: 1 Consensus: CCaCCtCCaCCgCCgCCacC |
motif_0191_2Submitted by Anonymous (not verified) on Wed, 05/20/2015 - 14:16 e.value: 2.9 Motif Bicluster: Width: 19 Number of Sites: 1 Consensus: CAcaCACGCaCAcgCAcAc |
| Interaction | Weight | |
|---|---|---|
| GO Terms | Descriptions |
|---|---|
| Not available |
Comments