motif_0193_1
Submitted by Anonymous (not verified) on Wed, 05/20/2015 - 14:16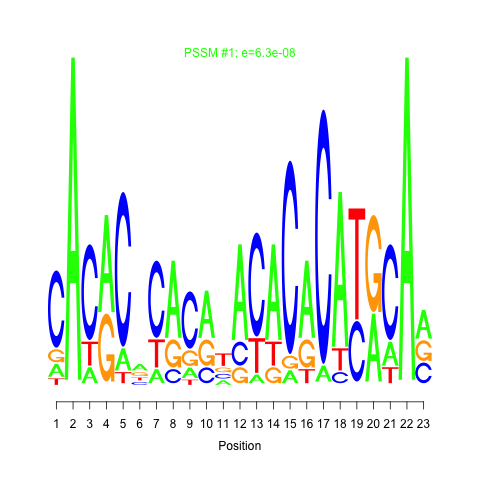
e.value:
0.000000063
Motif Bicluster:
Width:
23
Number of Sites:
1
Consensus:
CACaCacacatACACaCAtgCAa
| Title | Model version | Residual | Score |
|---|---|---|---|
| bicluster_0193 | v02 | 0.15 | -18.42 |
|
Differential Expression Time:
2 hour 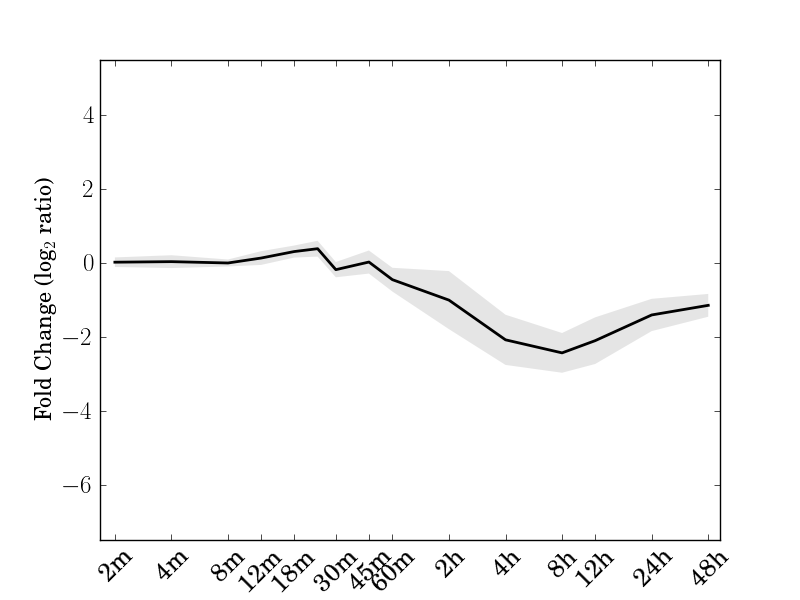 |
| Cre01.g014000.t1.2 | Cre01.g042800.t1.2 NAD(P)-binding Rossmann-fold superfamily protein |
| Cre02.g074100.t1.2 | Cre02.g114450.t1.2 |
| Cre03.g188250.t1.2 ADP glucose pyrophosphorylase 1 | Cre03.g201050.t1.2 thylakoid lumenal P17.1 protein |
| Cre06.g252650.t1.2 Aconitase/3-isopropylmalate dehydratase protein | Cre06.g273700.t1.2 photosystem II stability/assembly factor, chloroplast (HCF136) |
| Cre06.g303700.t1.2 | Cre12.g483650.t1.2 Protein kinase superfamily protein |
| Cre12.g554800.t1.2 phosphoribulokinase | Cre13.g567950.t1.2 ADPGLC-PPase large subunit |
| Cre13.g578650.t1.1 high chlorophyll fluorescence phenotype 173 | Cre14.g609300.t1.2 Haloacid dehalogenase-like hydrolase (HAD) superfamily protein |
| Cre16.g656400.t1.2 sulfoquinovosyldiacylglycerol 1 | Cre17.g696350.t1.2 |
| Cre17.g720050.t1.2 FtsH extracellular protease family |
motif_0193_1Submitted by Anonymous (not verified) on Wed, 05/20/2015 - 14:16e.value: 0.000000063 Motif Bicluster: Width: 23 Number of Sites: 1 Consensus: CACaCacacatACACaCAtgCAa |
motif_0193_2Submitted by Anonymous (not verified) on Wed, 05/20/2015 - 14:16 e.value: 19 Motif Bicluster: Width: 24 Number of Sites: 1 Consensus: gaGGtaGCAGtgGCgGgGGcaGCG |
| Interaction | Weight | |
|---|---|---|
| down-regulates |
Cre03.g149350.t1.1Submitted by admin on Tue, 05/19/2015 - 15:51RWP-RK domain-containing protein |
0.064115 |
| down-regulates |
Cre07.g341800.t1.2Submitted by admin on Tue, 05/19/2015 - 15:52nuclear factor Y, subunit B11 |
0.057312 |
| down-regulates |
Cre12.g523000.t1.1Submitted by admin on Tue, 05/19/2015 - 15:51zinc finger protein 1 |
0.06259 |
| down-regulates |
Cre08.g375400.t1.1Submitted by admin on Tue, 05/19/2015 - 15:51KNOTTED-like homeobox of Arabidopsis thaliana 7 |
0.068813 |
| GO Terms | Descriptions |
|---|---|
| Not available |
Comments