motif_0210_1
Submitted by Anonymous (not verified) on Wed, 05/20/2015 - 14:17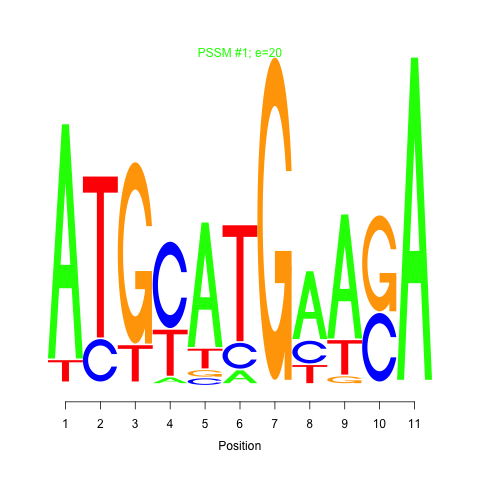
e.value:
20
Motif Bicluster:
Width:
11
Number of Sites:
1
Consensus:
ATGcATGaAgA
| Title | Model version | Residual | Score |
|---|---|---|---|
| bicluster_0210 | v02 | 0.12 | -11.90 |
|
Differential Expression Time:
8 hour 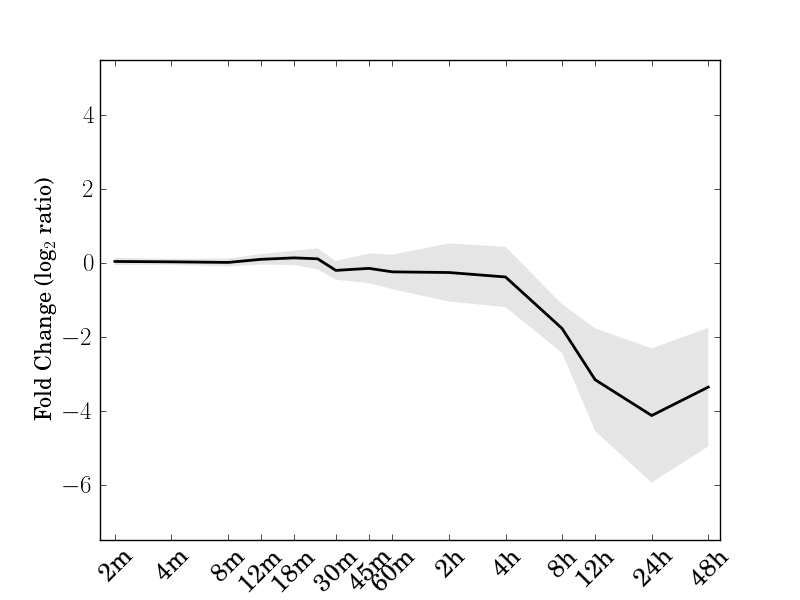 |
| Cre06.g265500.t1.2 Histone superfamily protein | Cre06.g284250.t1.2 photosystem II light harvesting complex gene 2.1 |
| Cre08.g376850.t2.1 | Cre09.g393543.t1.1 Hybrid-cluster protein |
| Cre09.g396438.t1.1 | Cre09.g398250.t1.1 |
| Cre09.g398400.t1.2 Transient receptor potential ion channel protein | Cre09.g399400.t2.1 Triacylglycerol lipase |
| Cre09.g404750.t1.1 Scavenger receptor cysteine rich (SRCR) protein | Cre10.g452250.t1.1 |
| Cre12.g529800.t1.1 RNI-like superfamily protein | Cre14.g621650.t1.1 catalytics;transferases;[acyl-carrier-protein] S-malonyltransferases;binding |
| Cre16.g682100.t1.2 NAD(P)-binding Rossmann-fold superfamily protein | Cre16.g694809.t1.2 |
| Cre18.g748297.t1.1 | Cre18.g748347.t1.1 |
| Cre24.g755997.t1.1 Cell wall protein pherophorin-C18 |
motif_0210_1Submitted by Anonymous (not verified) on Wed, 05/20/2015 - 14:17e.value: 20 Motif Bicluster: Width: 11 Number of Sites: 1 Consensus: ATGcATGaAgA |
motif_0210_2Submitted by Anonymous (not verified) on Wed, 05/20/2015 - 14:17 e.value: 0.15 Motif Bicluster: Width: 21 Number of Sites: 1 Consensus: GGCaGgAGcgGcAGtgGtaGC |
| Interaction | Weight | |
|---|---|---|
| up-regulates |
Cre06.g268600.t1.2Submitted by admin on Tue, 05/19/2015 - 15:51glycine-rich protein 2B |
0.032431 |
| GO Terms | Descriptions |
|---|---|
| Not available |
Comments