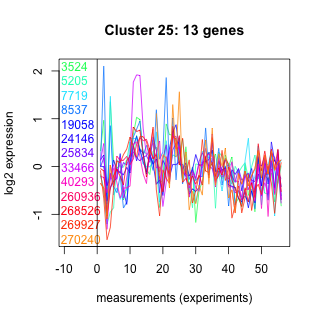
Thaps_hclust_0025 Hierarchical Clustering
Thalassiosira pseudonana
| Cluster Plot | Conditions Plot | Dendrogram |
|---|---|---|
 |
 |
 |
| GO ID | Go Term | p-value | q-value | Cluster |
|---|---|---|---|---|
| GO:0006820 | anion transport | 0.00824568 | 1 | Thaps_hclust_0025 |
| GO:0008654 | phospholipid biosynthesis | 0.0143942 | 1 | Thaps_hclust_0025 |
| GO:0006810 | transport | 0.176337 | 1 | Thaps_hclust_0025 |
| GO:0006118 | electron transport | 0.24643 | 1 | Thaps_hclust_0025 |
| GO:0006508 | proteolysis and peptidolysis | 0.264399 | 1 | Thaps_hclust_0025 |
|
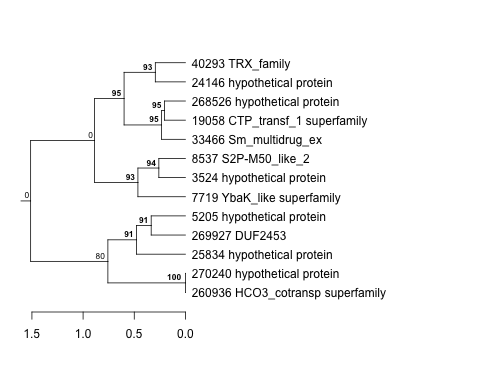
3524 : hypothetical protein |
19058 : CTP_transf_1 superfamily |
33466 : Sm_multidrug_ex |
268526 : hypothetical protein |
|
5205 : hypothetical protein |
24146 : hypothetical protein |
40293 : TRX_family |
269927 : DUF2453 |
|
7719 : YbaK_like superfamily |
25834 : hypothetical protein |
260936 : HCO3_cotransp superfamily |
270240 : hypothetical protein |
|
8537 : S2P-M50_like_2 |
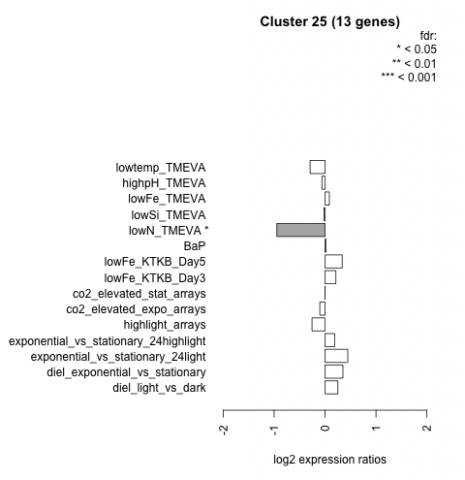
| Condition | Condition | Difference | FDR |
|---|---|---|---|
| diel_light_vs_dark | diel_light_vs_dark | 0.250 | 0.361 |
| lowFe_KTKB_Day3 | lowFe_KTKB_Day3 | 0.211 | 0.506 |
| lowFe_KTKB_Day5 | lowFe_KTKB_Day5 | 0.337 | 0.188 |
| BaP | BaP | 0.019 | 0.954 |
| exponential_vs_stationary_24highlight | exponential_vs_stationary_24highlight | 0.190 | 0.155 |
| co2_elevated_stat_arrays | co2_elevated_stat_arrays | -0.003 | 0.993 |
| lowtemp_TMEVA | lowtemp_TMEVA | -0.293 | 0.355 |
| highpH_TMEVA | highpH_TMEVA | -0.061 | 0.804 |
| co2_elevated_expo_arrays | co2_elevated_expo_arrays | -0.102 | 0.748 |
| lowFe_TMEVA | lowFe_TMEVA | 0.084 | 0.853 |
| exponential_vs_stationary_24light | exponential_vs_stationary_24light | 0.447 | 0.243 |
| lowN_TMEVA | lowN_TMEVA | -0.948 | 0.0142 |
| diel_exponential_vs_stationary | diel_exponential_vs_stationary | 0.351 | 0.114 |
| lowSi_TMEVA | lowSi_TMEVA | -0.020 | 1 |
| highlight_arrays | highlight_arrays | -0.256 | 0.187 |