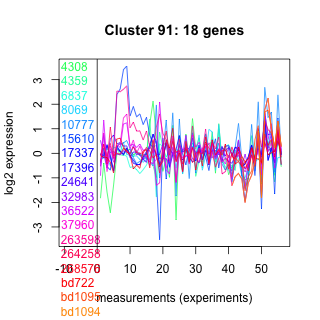
Thaps_hclust_0091 Hierarchical Clustering
Thalassiosira pseudonana
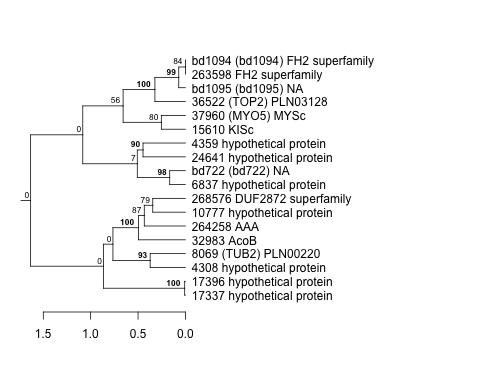
| Cluster Plot | Conditions Plot | Dendrogram |
|---|---|---|
 |
 |
 |
| GO ID | Go Term | p-value | q-value | Cluster |
|---|---|---|---|---|
| GO:0007018 | microtubule-based movement | 0.00208959 | 1 | Thaps_hclust_0091 |
| GO:0000074 | regulation of cell cycle | 0.00403851 | 1 | Thaps_hclust_0091 |
| GO:0016043 | cell organization and biogenesis | 0.00824568 | 1 | Thaps_hclust_0091 |
| GO:0051258 | protein polymerization | 0.0131645 | 1 | Thaps_hclust_0091 |
| GO:0006265 | DNA topological change | 0.0164318 | 1 | Thaps_hclust_0091 |
| GO:0006259 | DNA metabolism | 0.0229381 | 1 | Thaps_hclust_0091 |
|
4308 : hypothetical protein |
15610 : KISc |
36522 : (TOP2) PLN03128 |
268576 : DUF2872 superfamily |
|
4359 : hypothetical protein |
17337 : hypothetical protein |
37960 : (MYO5) MYSc |
bd722 : (bd722) NA |
|
6837 : hypothetical protein |
17396 : hypothetical protein |
263598 : FH2 superfamily |
bd1095 : (bd1095) NA |
|
8069 : (TUB2) PLN00220 |
24641 : hypothetical protein |
264258 : AAA |
bd1094 : (bd1094) FH2 superfamily |
|
10777 : hypothetical protein |
32983 : AcoB |
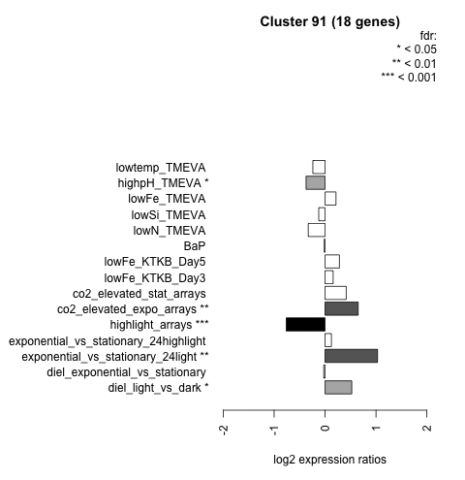
| Condition | Condition | Difference | FDR |
|---|---|---|---|
| diel_light_vs_dark | diel_light_vs_dark | 0.524 | 0.0127 |
| lowFe_KTKB_Day3 | lowFe_KTKB_Day3 | 0.158 | 0.581 |
| lowFe_KTKB_Day5 | lowFe_KTKB_Day5 | 0.282 | 0.179 |
| BaP | BaP | -0.017 | 0.954 |
| exponential_vs_stationary_24highlight | exponential_vs_stationary_24highlight | 0.125 | 0.279 |
| co2_elevated_stat_arrays | co2_elevated_stat_arrays | 0.416 | 0.0668 |
| lowtemp_TMEVA | lowtemp_TMEVA | -0.240 | 0.384 |
| highpH_TMEVA | highpH_TMEVA | -0.373 | 0.0268 |
| co2_elevated_expo_arrays | co2_elevated_expo_arrays | 0.650 | 0.00139 |
| lowFe_TMEVA | lowFe_TMEVA | 0.214 | 0.464 |
| exponential_vs_stationary_24light | exponential_vs_stationary_24light | 1.030 | 0.00112 |
| lowN_TMEVA | lowN_TMEVA | -0.330 | 0.349 |
| diel_exponential_vs_stationary | diel_exponential_vs_stationary | -0.026 | 0.916 |
| lowSi_TMEVA | lowSi_TMEVA | -0.124 | 0.976 |
| highlight_arrays | highlight_arrays | -0.763 | 0.000442 |