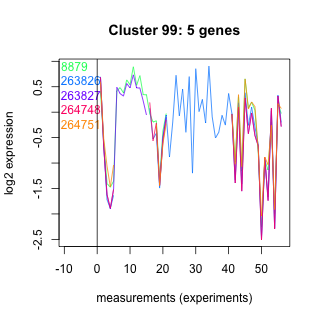
Thaps_hclust_0099 Hierarchical Clustering
Thalassiosira pseudonana
| Cluster Plot | Conditions Plot | Dendrogram |
|---|---|---|
 |
 |
 |
| GO ID | Go Term | p-value | q-value | Cluster |
|---|---|---|---|---|
| GO:0006468 | protein amino acid phosphorylation | 0.000000158 | 0.000579087 | Thaps_hclust_0099 |
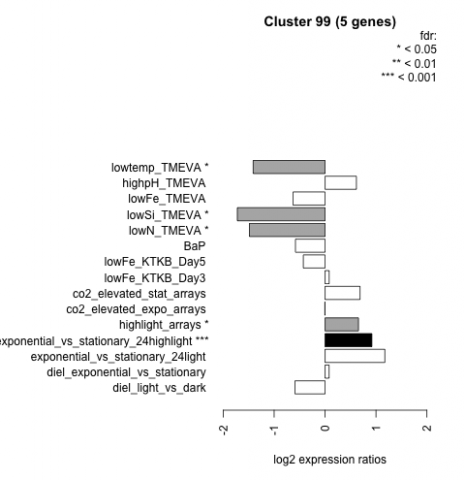
| Condition | Condition | Difference | FDR |
|---|---|---|---|
| diel_light_vs_dark | diel_light_vs_dark | -0.590 | 0.152 |
| lowFe_KTKB_Day3 | lowFe_KTKB_Day3 | 0.080 | 0.887 |
| lowFe_KTKB_Day5 | lowFe_KTKB_Day5 | -0.427 | 0.284 |
| BaP | BaP | -0.581 | 0.183 |
| exponential_vs_stationary_24highlight | exponential_vs_stationary_24highlight | 0.919 | 0.000526 |
| co2_elevated_stat_arrays | co2_elevated_stat_arrays | 0.686 | 0.0703 |
| lowtemp_TMEVA | lowtemp_TMEVA | -1.410 | 0.0207 |
| highpH_TMEVA | highpH_TMEVA | 0.615 | 0.0533 |
| co2_elevated_expo_arrays | co2_elevated_expo_arrays | -0.003 | 1 |
| lowFe_TMEVA | lowFe_TMEVA | -0.629 | 0.216 |
| exponential_vs_stationary_24light | exponential_vs_stationary_24light | 1.170 | 0.0556 |
| lowN_TMEVA | lowN_TMEVA | -1.480 | 0.0274 |
| diel_exponential_vs_stationary | diel_exponential_vs_stationary | 0.079 | 0.837 |
| lowSi_TMEVA | lowSi_TMEVA | -1.720 | 0.0212 |
| highlight_arrays | highlight_arrays | 0.656 | 0.0369 |