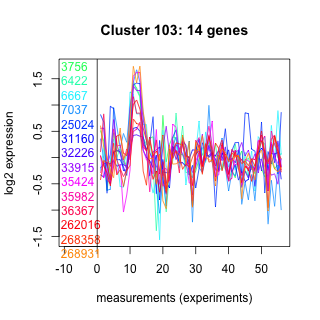
Thaps_hclust_0103 Hierarchical Clustering
Thalassiosira pseudonana
| Cluster Plot | Conditions Plot | Dendrogram |
|---|---|---|
 |
 |
 |
| GO ID | Go Term | p-value | q-value | Cluster |
|---|---|---|---|---|
| GO:0006461 | protein complex assembly | 0.00865617 | 1 | Thaps_hclust_0103 |
| GO:0051341 | regulation of oxidoreductase activity | 0.0282075 | 1 | Thaps_hclust_0103 |
| GO:0006306 | DNA methylation | 0.0354559 | 1 | Thaps_hclust_0103 |
| GO:0006865 | amino acid transport | 0.0354559 | 1 | Thaps_hclust_0103 |
| GO:0006810 | transport | 0.207702 | 1 | Thaps_hclust_0103 |
| GO:0006468 | protein amino acid phosphorylation | 0.236888 | 1 | Thaps_hclust_0103 |
|
3756 : hypothetical protein |
25024 : SEP superfamily |
35424 : PKc_like superfamily |
262016 : Aa_trans superfamily |
|
6422 : hypothetical protein |
31160 : Sec3_C superfamily |
35982 : COX15-CtaA |
268358 : hypothetical protein |
|
6667 : CAS_like superfamily |
32226 : CLPTM1 superfamily |
36367 : WD40 |
268931 : hypothetical protein |
|
7037 : Aldo_ket_red |
33915 : Mito_carr |
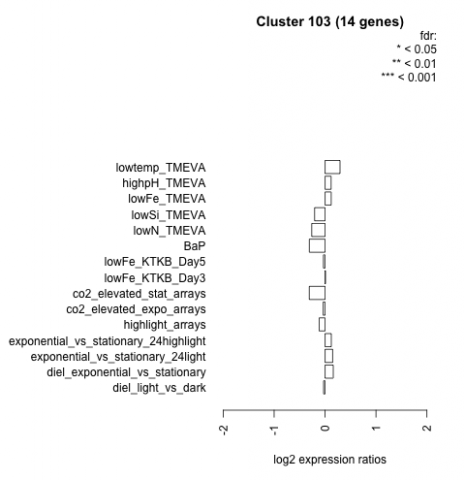
| Condition | Condition | Difference | FDR |
|---|---|---|---|
| diel_light_vs_dark | diel_light_vs_dark | -0.029 | 0.952 |
| lowFe_KTKB_Day3 | lowFe_KTKB_Day3 | 0.009 | 0.978 |
| lowFe_KTKB_Day5 | lowFe_KTKB_Day5 | -0.032 | 0.908 |
| BaP | BaP | -0.308 | 0.239 |
| exponential_vs_stationary_24highlight | exponential_vs_stationary_24highlight | 0.123 | 0.355 |
| co2_elevated_stat_arrays | co2_elevated_stat_arrays | -0.309 | 0.229 |
| lowtemp_TMEVA | lowtemp_TMEVA | 0.294 | 0.33 |
| highpH_TMEVA | highpH_TMEVA | 0.118 | 0.555 |
| co2_elevated_expo_arrays | co2_elevated_expo_arrays | -0.038 | 0.943 |
| lowFe_TMEVA | lowFe_TMEVA | 0.121 | 0.773 |
| exponential_vs_stationary_24light | exponential_vs_stationary_24light | 0.150 | 0.747 |
| lowN_TMEVA | lowN_TMEVA | -0.262 | 0.51 |
| diel_exponential_vs_stationary | diel_exponential_vs_stationary | 0.161 | 0.493 |
| lowSi_TMEVA | lowSi_TMEVA | -0.206 | 0.854 |
| highlight_arrays | highlight_arrays | -0.115 | 0.567 |