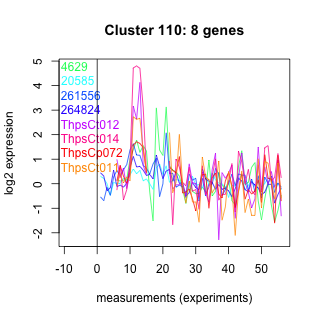
Thaps_hclust_0110 Hierarchical Clustering
Thalassiosira pseudonana
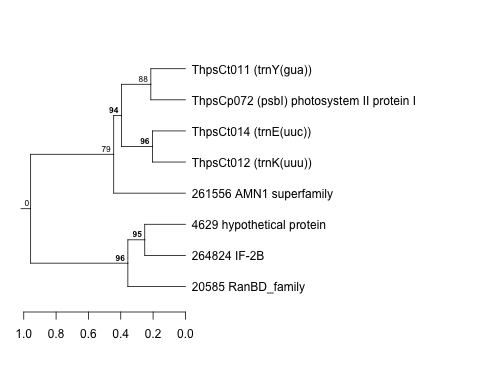
| Cluster Plot | Conditions Plot | Dendrogram |
|---|---|---|
 |
 |
 |
| GO ID | Go Term | p-value | q-value | Cluster |
|---|---|---|---|---|
| GO:0006413 | translational initiation | 0.00496175 | 1 | Thaps_hclust_0110 |
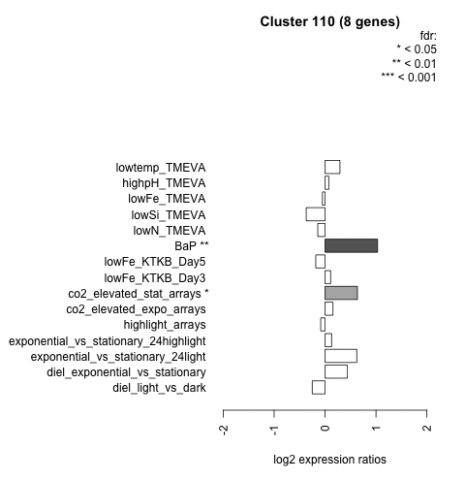
| Condition | Condition | Difference | FDR |
|---|---|---|---|
| diel_light_vs_dark | diel_light_vs_dark | -0.251 | 0.491 |
| lowFe_KTKB_Day3 | lowFe_KTKB_Day3 | 0.110 | 0.795 |
| lowFe_KTKB_Day5 | lowFe_KTKB_Day5 | -0.183 | 0.581 |
| BaP | BaP | 1.030 | 0.00431 |
| exponential_vs_stationary_24highlight | exponential_vs_stationary_24highlight | 0.130 | 0.457 |
| co2_elevated_stat_arrays | co2_elevated_stat_arrays | 0.636 | 0.0394 |
| lowtemp_TMEVA | lowtemp_TMEVA | 0.292 | 0.445 |
| highpH_TMEVA | highpH_TMEVA | 0.074 | 0.799 |
| co2_elevated_expo_arrays | co2_elevated_expo_arrays | 0.155 | 0.6 |
| lowFe_TMEVA | lowFe_TMEVA | -0.052 | 0.911 |
| exponential_vs_stationary_24light | exponential_vs_stationary_24light | 0.624 | 0.178 |
| lowN_TMEVA | lowN_TMEVA | -0.143 | 0.761 |
| diel_exponential_vs_stationary | diel_exponential_vs_stationary | 0.438 | 0.125 |
| lowSi_TMEVA | lowSi_TMEVA | -0.369 | 0.643 |
| highlight_arrays | highlight_arrays | -0.085 | 0.761 |