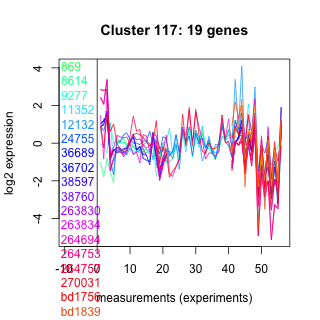
Thaps_hclust_0117 Hierarchical Clustering
Thalassiosira pseudonana
| Cluster Plot | Conditions Plot | Dendrogram |
|---|---|---|
 |
 |
 |
| GO ID | Go Term | p-value | q-value | Cluster |
|---|---|---|---|---|
| GO:0006800 | oxygen and reactive oxygen species metabolism | 0.0000000000314 | 0.000000115 | Thaps_hclust_0117 |
| GO:0006006 | glucose metabolism | 0.00000000653 | 0.0000239 | Thaps_hclust_0117 |
| GO:0008152 | metabolism | 0.0191389 | 1 | Thaps_hclust_0117 |
| GO:0006298 | mismatch repair | 0.04221 | 1 | Thaps_hclust_0117 |
|
869 : hypothetical protein |
24755 : hypothetical protein |
263830 : RNR_PFL superfamily |
270031 : MhpC |
|
8614 : hypothetical protein |
36689 : pyr_form_ly_1 |
263834 : RNR_PFL superfamily |
bd1756 : (bd1756) NA |
|
9277 : hypothetical protein |
36702 : pyr_form_ly_1 |
264694 : ACD_sHsps-like |
bd1839 : (bd1839) NA |
|
11352 : hypothetical protein |
38597 : pyr_form_ly_1 |
264753 : RNR_PFL superfamily |
bd1840 : (bd1840) NA |
|
12132 : hypothetical protein |
38760 : pyr_form_ly_1 |
264757 : RNR_PFL superfamily |
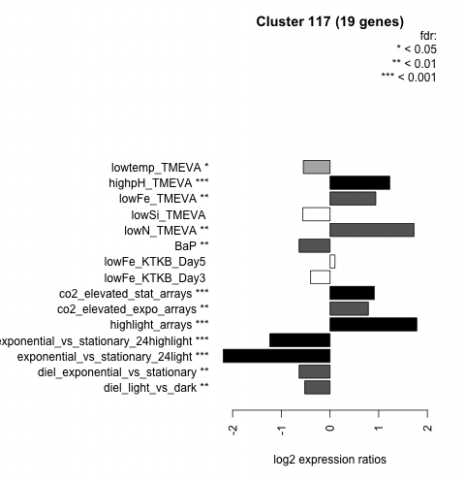
| Condition | Condition | Difference | FDR |
|---|---|---|---|
| diel_light_vs_dark | diel_light_vs_dark | -0.519 | 0.00784 |
| lowFe_KTKB_Day3 | lowFe_KTKB_Day3 | -0.399 | 0.0937 |
| lowFe_KTKB_Day5 | lowFe_KTKB_Day5 | 0.101 | 0.646 |
| BaP | BaP | -0.637 | 0.00273 |
| exponential_vs_stationary_24highlight | exponential_vs_stationary_24highlight | -1.240 | 0.000526 |
| co2_elevated_stat_arrays | co2_elevated_stat_arrays | 0.910 | 0.000658 |
| lowtemp_TMEVA | lowtemp_TMEVA | -0.548 | 0.0364 |
| highpH_TMEVA | highpH_TMEVA | 1.230 | 0.000725 |
| co2_elevated_expo_arrays | co2_elevated_expo_arrays | 0.788 | 0.00139 |
| lowFe_TMEVA | lowFe_TMEVA | 0.941 | 0.00104 |
| exponential_vs_stationary_24light | exponential_vs_stationary_24light | -2.190 | 0.000581 |
| lowN_TMEVA | lowN_TMEVA | 1.730 | 0.00119 |
| diel_exponential_vs_stationary | diel_exponential_vs_stationary | -0.635 | 0.00111 |
| lowSi_TMEVA | lowSi_TMEVA | -0.559 | 0.248 |
| highlight_arrays | highlight_arrays | 1.780 | 0.000442 |