Thaps_hclust_0124 Hierarchical Clustering
Thalassiosira pseudonana
| Cluster Plot | Conditions Plot | Dendrogram |
|---|---|---|
 |
 |
 |
| GO ID | Go Term | p-value | q-value | Cluster |
|---|---|---|---|---|
| GO:0006334 | nucleosome assembly | 0.0191078 | 1 | Thaps_hclust_0124 |
| GO:0006810 | transport | 0.109856 | 1 | Thaps_hclust_0124 |
| GO:0006355 | regulation of transcription, DNA-dependent | 0.178613 | 1 | Thaps_hclust_0124 |
|
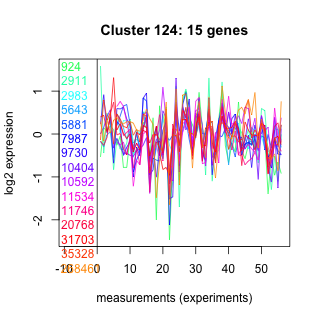
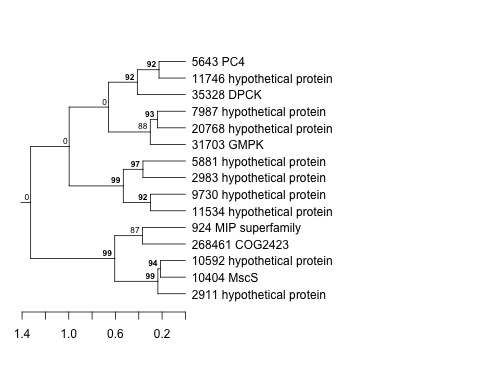
924 : MIP superfamily |
5881 : hypothetical protein |
10592 : hypothetical protein |
31703 : GMPK |
|
2911 : hypothetical protein |
7987 : hypothetical protein |
11534 : hypothetical protein |
35328 : DPCK |
|
2983 : hypothetical protein |
9730 : hypothetical protein |
11746 : hypothetical protein |
268461 : COG2423 |
|
5643 : PC4 |
10404 : MscS |
20768 : hypothetical protein |
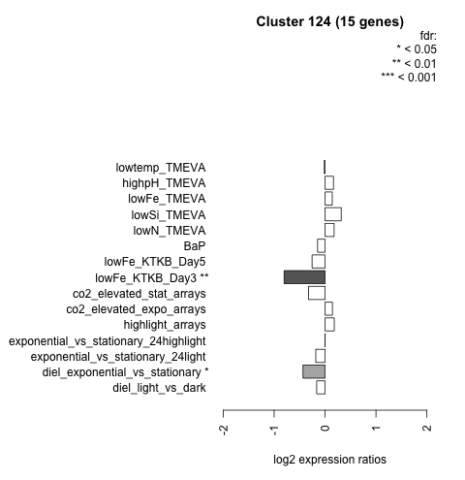
| Condition | Condition | Difference | FDR |
|---|---|---|---|
| diel_light_vs_dark | diel_light_vs_dark | -0.165 | 0.557 |
| lowFe_KTKB_Day3 | lowFe_KTKB_Day3 | -0.803 | 0.00299 |
| lowFe_KTKB_Day5 | lowFe_KTKB_Day5 | -0.254 | 0.284 |
| BaP | BaP | -0.148 | 0.586 |
| exponential_vs_stationary_24highlight | exponential_vs_stationary_24highlight | -0.002 | 0.988 |
| co2_elevated_stat_arrays | co2_elevated_stat_arrays | -0.324 | 0.189 |
| lowtemp_TMEVA | lowtemp_TMEVA | -0.017 | 0.964 |
| highpH_TMEVA | highpH_TMEVA | 0.166 | 0.372 |
| co2_elevated_expo_arrays | co2_elevated_expo_arrays | 0.145 | 0.513 |
| lowFe_TMEVA | lowFe_TMEVA | 0.141 | 0.709 |
| exponential_vs_stationary_24light | exponential_vs_stationary_24light | -0.182 | 0.664 |
| lowN_TMEVA | lowN_TMEVA | 0.177 | 0.666 |
| diel_exponential_vs_stationary | diel_exponential_vs_stationary | -0.434 | 0.0287 |
| lowSi_TMEVA | lowSi_TMEVA | 0.318 | 0.67 |
| highlight_arrays | highlight_arrays | 0.181 | 0.331 |