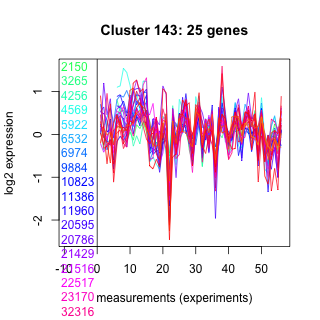
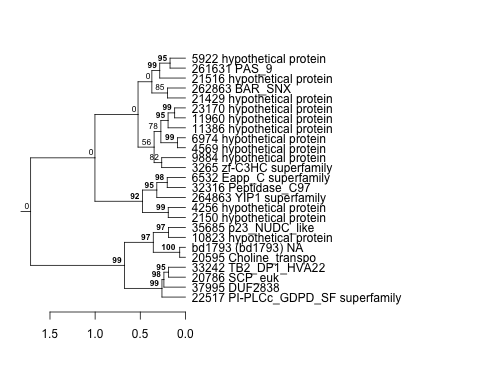
Thaps_hclust_0143 Hierarchical Clustering
Thalassiosira pseudonana
| Cluster Plot | Conditions Plot | Dendrogram |
|---|---|---|
 |
 |
 |
| GO ID | Go Term | p-value | q-value | Cluster |
|---|---|---|---|---|
| GO:0007165 | signal transduction | 0.0326803 | 1 | Thaps_hclust_0143 |
| GO:0007242 | intracellular signaling cascade | 0.034293 | 1 | Thaps_hclust_0143 |
| GO:0008152 | metabolism | 0.0377993 | 1 | Thaps_hclust_0143 |
|
2150 : hypothetical protein |
9884 : hypothetical protein |
21429 : hypothetical protein |
35685 : p23_NUDC_like |
|
3265 : zf-C3HC superfamily |
10823 : hypothetical protein |
21516 : hypothetical protein |
37995 : DUF2838 |
|
4256 : hypothetical protein |
11386 : hypothetical protein |
22517 : PI-PLCc_GDPD_SF superfamily |
261631 : PAS_9 |
|
4569 : hypothetical protein |
11960 : hypothetical protein |
23170 : hypothetical protein |
262863 : BAR_SNX |
|
5922 : hypothetical protein |
20595 : Choline_transpo |
32316 : Peptidase_C97 |
264863 : YIP1 superfamily |
|
6532 : Eapp_C superfamily |
20786 : SCP_euk |
33242 : TB2_DP1_HVA22 |
bd1793 : (bd1793) NA |
|
6974 : hypothetical protein |
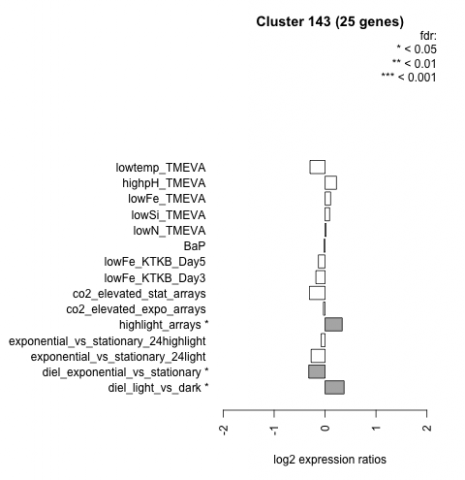
| Condition | Condition | Difference | FDR |
|---|---|---|---|
| highlight_arrays | highlight_arrays | 0.337 | 0.0148 |
| lowSi_TMEVA | lowSi_TMEVA | 0.090 | 1 |
| diel_exponential_vs_stationary | diel_exponential_vs_stationary | -0.320 | 0.0317 |
| lowN_TMEVA | lowN_TMEVA | 0.018 | 0.963 |
| exponential_vs_stationary_24light | exponential_vs_stationary_24light | -0.273 | 0.368 |
| lowFe_TMEVA | lowFe_TMEVA | 0.110 | 0.761 |
| co2_elevated_expo_arrays | co2_elevated_expo_arrays | -0.032 | 0.944 |
| highpH_TMEVA | highpH_TMEVA | 0.225 | 0.115 |
| lowtemp_TMEVA | lowtemp_TMEVA | -0.295 | 0.195 |
| co2_elevated_stat_arrays | co2_elevated_stat_arrays | -0.307 | 0.146 |
| exponential_vs_stationary_24highlight | exponential_vs_stationary_24highlight | -0.076 | 0.452 |
| BaP | BaP | -0.021 | 0.93 |
| lowFe_KTKB_Day5 | lowFe_KTKB_Day5 | -0.132 | 0.496 |
| lowFe_KTKB_Day3 | lowFe_KTKB_Day3 | -0.180 | 0.447 |
| diel_light_vs_dark | diel_light_vs_dark | 0.374 | 0.0305 |