Thaps_hclust_0145 Hierarchical Clustering
Thalassiosira pseudonana
| Cluster Plot | Conditions Plot | Dendrogram |
|---|---|---|
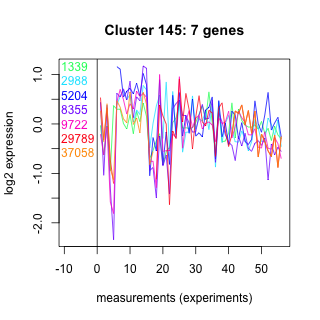 |
 |
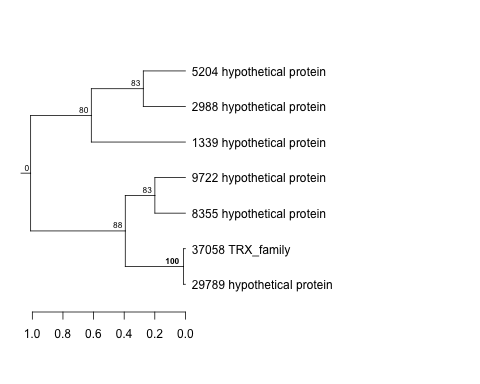 |
| GO ID | Go Term | p-value | q-value | Cluster |
|---|---|---|---|---|
| GO:0015979 | photosynthesis | 0.00536856 | 1 | Thaps_hclust_0145 |
| GO:0006118 | electron transport | 0.106972 | 1 | Thaps_hclust_0145 |
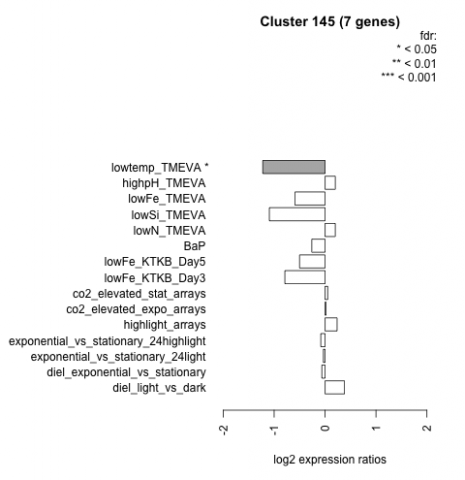
| Condition | Condition | Difference | FDR |
|---|---|---|---|
| diel_light_vs_dark | diel_light_vs_dark | 0.381 | 0.293 |
| lowFe_KTKB_Day3 | lowFe_KTKB_Day3 | -0.789 | 0.0574 |
| lowFe_KTKB_Day5 | lowFe_KTKB_Day5 | -0.500 | 0.15 |
| BaP | BaP | -0.261 | 0.498 |
| exponential_vs_stationary_24highlight | exponential_vs_stationary_24highlight | -0.083 | 0.66 |
| co2_elevated_stat_arrays | co2_elevated_stat_arrays | 0.053 | 0.892 |
| lowtemp_TMEVA | lowtemp_TMEVA | -1.220 | 0.0171 |
| highpH_TMEVA | highpH_TMEVA | 0.201 | 0.435 |
| co2_elevated_expo_arrays | co2_elevated_expo_arrays | 0.019 | 0.985 |
| lowFe_TMEVA | lowFe_TMEVA | -0.592 | 0.181 |
| exponential_vs_stationary_24light | exponential_vs_stationary_24light | -0.033 | 0.957 |
| lowN_TMEVA | lowN_TMEVA | 0.201 | 0.684 |
| diel_exponential_vs_stationary | diel_exponential_vs_stationary | -0.062 | 0.86 |
| lowSi_TMEVA | lowSi_TMEVA | -1.090 | 0.0868 |
| highlight_arrays | highlight_arrays | 0.236 | 0.381 |