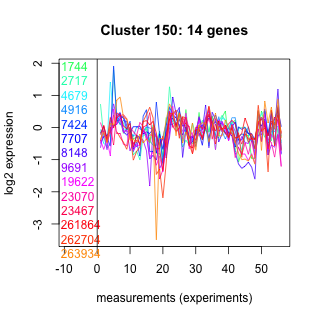
Thaps_hclust_0150 Hierarchical Clustering
Thalassiosira pseudonana
| Cluster Plot | Conditions Plot | Dendrogram |
|---|---|---|
 |
 |
 |
| GO ID | Go Term | p-value | q-value | Cluster |
|---|---|---|---|---|
| GO:0006888 | ER to Golgi transport | 0.00247959 | 1 | Thaps_hclust_0150 |
| GO:0019538 | protein metabolism | 0.0189316 | 1 | Thaps_hclust_0150 |
|
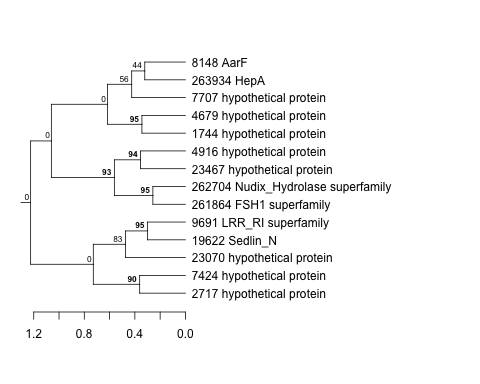
1744 : hypothetical protein |
7424 : hypothetical protein |
19622 : Sedlin_N |
261864 : FSH1 superfamily |
|
2717 : hypothetical protein |
7707 : hypothetical protein |
23070 : hypothetical protein |
262704 : Nudix_Hydrolase superfamily |
|
4679 : hypothetical protein |
8148 : AarF |
23467 : hypothetical protein |
263934 : HepA |
|
4916 : hypothetical protein |
9691 : LRR_RI superfamily |
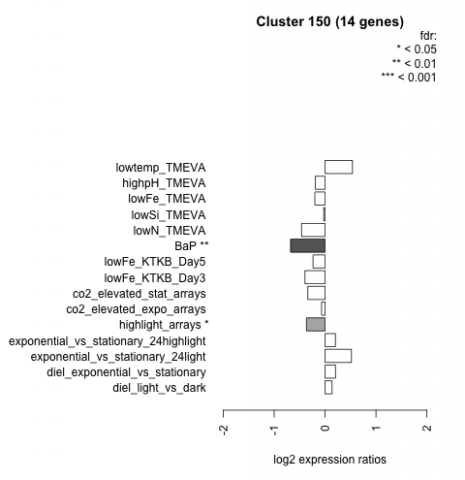
| Condition | Condition | Difference | FDR |
|---|---|---|---|
| diel_light_vs_dark | diel_light_vs_dark | 0.137 | 0.656 |
| lowFe_KTKB_Day3 | lowFe_KTKB_Day3 | -0.395 | 0.154 |
| lowFe_KTKB_Day5 | lowFe_KTKB_Day5 | -0.236 | 0.337 |
| BaP | BaP | -0.677 | 0.00583 |
| exponential_vs_stationary_24highlight | exponential_vs_stationary_24highlight | 0.204 | 0.102 |
| co2_elevated_stat_arrays | co2_elevated_stat_arrays | -0.339 | 0.178 |
| lowtemp_TMEVA | lowtemp_TMEVA | 0.538 | 0.0784 |
| highpH_TMEVA | highpH_TMEVA | -0.191 | 0.306 |
| co2_elevated_expo_arrays | co2_elevated_expo_arrays | -0.069 | 0.873 |
| lowFe_TMEVA | lowFe_TMEVA | -0.200 | 0.552 |
| exponential_vs_stationary_24light | exponential_vs_stationary_24light | 0.517 | 0.155 |
| lowN_TMEVA | lowN_TMEVA | -0.461 | 0.24 |
| diel_exponential_vs_stationary | diel_exponential_vs_stationary | 0.206 | 0.366 |
| lowSi_TMEVA | lowSi_TMEVA | -0.026 | 1 |
| highlight_arrays | highlight_arrays | -0.366 | 0.0471 |