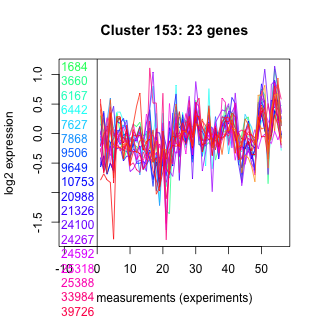
Thaps_hclust_0153 Hierarchical Clustering
Thalassiosira pseudonana
| Cluster Plot | Conditions Plot | Dendrogram |
|---|---|---|
 |
 |
 |
| GO ID | Go Term | p-value | q-value | Cluster |
|---|---|---|---|---|
| GO:0000226 | microtubule cytoskeleton organization and biogenesis | 0.00371824 | 1 | Thaps_hclust_0153 |
| GO:0006468 | protein amino acid phosphorylation | 0.00580719 | 1 | Thaps_hclust_0153 |
| GO:0007049 | cell cycle | 0.0129601 | 1 | Thaps_hclust_0153 |
| GO:0006813 | potassium ion transport | 0.0402303 | 1 | Thaps_hclust_0153 |
| GO:0006306 | DNA methylation | 0.0527255 | 1 | Thaps_hclust_0153 |
| GO:0006457 | protein folding | 0.217609 | 1 | Thaps_hclust_0153 |
| GO:0006508 | proteolysis and peptidolysis | 0.424754 | 1 | Thaps_hclust_0153 |
|
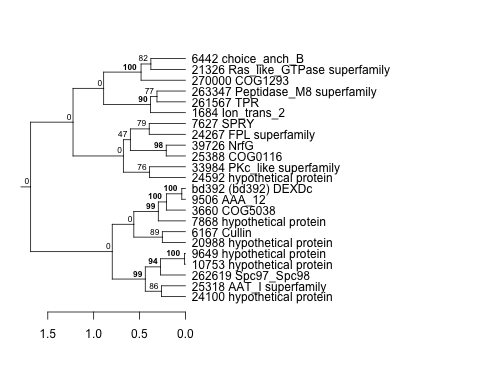
1684 : Ion_trans_2 |
9506 : AAA_12 |
24267 : FPL superfamily |
261567 : TPR |
|
3660 : COG5038 |
9649 : hypothetical protein |
24592 : hypothetical protein |
262619 : Spc97_Spc98 |
|
6167 : Cullin |
10753 : hypothetical protein |
25318 : AAT_I superfamily |
263347 : Peptidase_M8 superfamily |
|
6442 : choice_anch_B |
20988 : hypothetical protein |
25388 : COG0116 |
270000 : COG1293 |
|
7627 : SPRY |
21326 : Ras_like_GTPase superfamily |
33984 : PKc_like superfamily |
bd392 : (bd392) DEXDc |
|
7868 : hypothetical protein |
24100 : hypothetical protein |
39726 : NrfG |
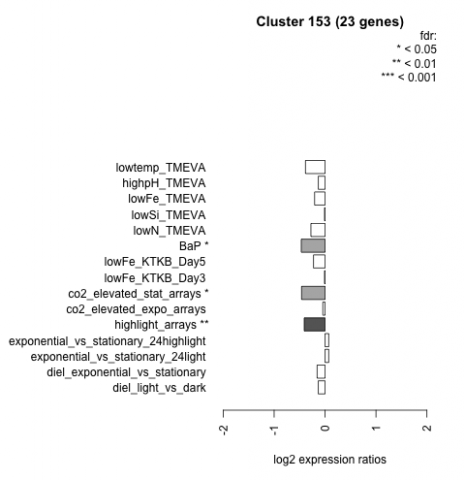
| Condition | Condition | Difference | FDR |
|---|---|---|---|
| highlight_arrays | highlight_arrays | -0.409 | 0.0035 |
| co2_elevated_stat_arrays | co2_elevated_stat_arrays | -0.461 | 0.0177 |
| BaP | BaP | -0.467 | 0.019 |
| lowtemp_TMEVA | lowtemp_TMEVA | -0.384 | 0.102 |
| lowFe_KTKB_Day5 | lowFe_KTKB_Day5 | -0.227 | 0.234 |
| diel_exponential_vs_stationary | diel_exponential_vs_stationary | -0.155 | 0.382 |
| highpH_TMEVA | highpH_TMEVA | -0.133 | 0.396 |
| lowN_TMEVA | lowN_TMEVA | -0.278 | 0.4 |
| lowFe_TMEVA | lowFe_TMEVA | -0.206 | 0.445 |
| exponential_vs_stationary_24highlight | exponential_vs_stationary_24highlight | 0.073 | 0.498 |
| diel_light_vs_dark | diel_light_vs_dark | -0.133 | 0.566 |
| exponential_vs_stationary_24light | exponential_vs_stationary_24light | 0.073 | 0.86 |
| co2_elevated_expo_arrays | co2_elevated_expo_arrays | -0.043 | 0.934 |
| lowFe_KTKB_Day3 | lowFe_KTKB_Day3 | -0.011 | 0.974 |
| lowSi_TMEVA | lowSi_TMEVA | -0.010 | 1 |