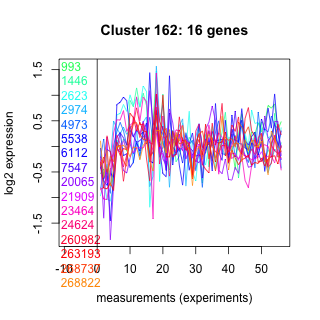
Thaps_hclust_0162 Hierarchical Clustering
Thalassiosira pseudonana
| Cluster Plot | Conditions Plot | Dendrogram |
|---|---|---|
 |
 |
 |
| GO ID | Go Term | p-value | q-value | Cluster |
|---|---|---|---|---|
| GO:0007165 | signal transduction | 0.0246092 | 1 | Thaps_hclust_0162 |
| GO:0009058 | biosynthesis | 0.0337325 | 1 | Thaps_hclust_0162 |
| GO:0006355 | regulation of transcription, DNA-dependent | 0.178613 | 1 | Thaps_hclust_0162 |
|
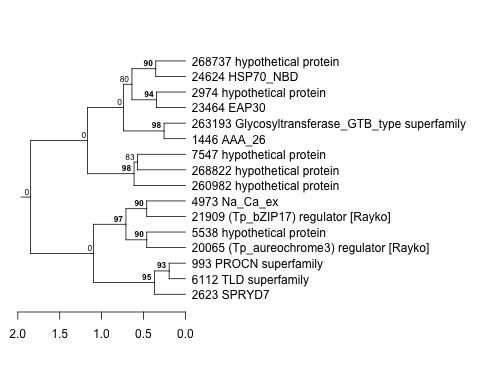
993 : PROCN superfamily |
4973 : Na_Ca_ex |
20065 : (Tp_aureochrome3) regulator [Rayko] |
260982 : hypothetical protein |
|
1446 : AAA_26 |
5538 : hypothetical protein |
21909 : (Tp_bZIP17) regulator [Rayko] |
263193 : Glycosyltransferase_GTB_type superfamily |
|
2623 : SPRYD7 |
6112 : TLD superfamily |
23464 : EAP30 |
268737 : hypothetical protein |
|
2974 : hypothetical protein |
7547 : hypothetical protein |
24624 : HSP70_NBD |
268822 : hypothetical protein |
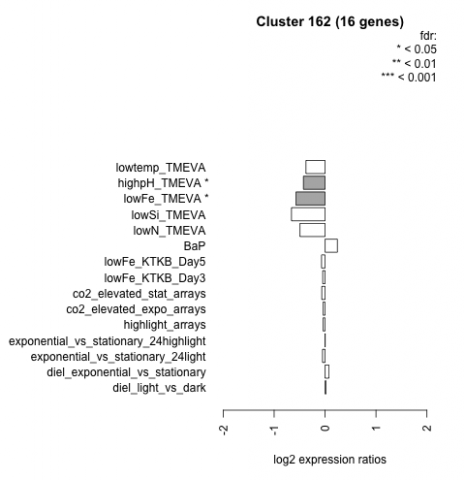
| Condition | Condition | Difference | FDR |
|---|---|---|---|
| diel_light_vs_dark | diel_light_vs_dark | 0.019 | 0.959 |
| lowFe_KTKB_Day3 | lowFe_KTKB_Day3 | -0.045 | 0.903 |
| lowFe_KTKB_Day5 | lowFe_KTKB_Day5 | -0.070 | 0.787 |
| BaP | BaP | 0.242 | 0.338 |
| exponential_vs_stationary_24highlight | exponential_vs_stationary_24highlight | 0.002 | 0.988 |
| co2_elevated_stat_arrays | co2_elevated_stat_arrays | -0.064 | 0.831 |
| lowtemp_TMEVA | lowtemp_TMEVA | -0.376 | 0.189 |
| highpH_TMEVA | highpH_TMEVA | -0.424 | 0.0171 |
| co2_elevated_expo_arrays | co2_elevated_expo_arrays | -0.040 | 0.943 |
| lowFe_TMEVA | lowFe_TMEVA | -0.573 | 0.0401 |
| exponential_vs_stationary_24light | exponential_vs_stationary_24light | -0.050 | 0.902 |
| lowN_TMEVA | lowN_TMEVA | -0.493 | 0.176 |
| diel_exponential_vs_stationary | diel_exponential_vs_stationary | 0.077 | 0.752 |
| lowSi_TMEVA | lowSi_TMEVA | -0.660 | 0.162 |
| highlight_arrays | highlight_arrays | -0.039 | 0.842 |