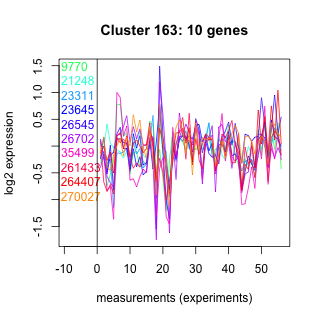
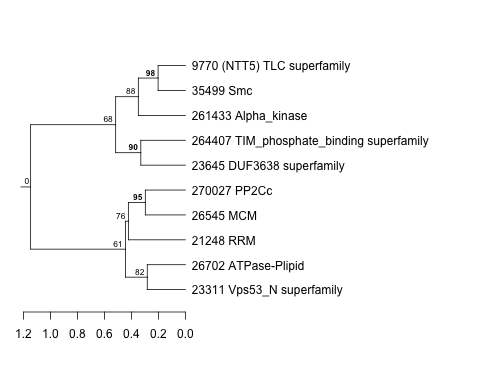
Thaps_hclust_0163 Hierarchical Clustering
Thalassiosira pseudonana
| Cluster Plot | Conditions Plot | Dendrogram |
|---|---|---|
 |
 |
 |
| GO ID | Go Term | p-value | q-value | Cluster |
|---|---|---|---|---|
| GO:0006812 | cation transport | 0.06063 | 1 | Thaps_hclust_0163 |
| GO:0051276 | chromosome organization and biogenesis | 0.00721795 | 1 | Thaps_hclust_0163 |
| GO:0006306 | DNA methylation | 0.0412459 | 1 | Thaps_hclust_0163 |
| GO:0006270 | DNA replication initiation | 0.0129601 | 1 | Thaps_hclust_0163 |
| GO:0006470 | protein amino acid dephosphorylation | 0.0370479 | 1 | Thaps_hclust_0163 |
| GO:0006468 | protein amino acid phosphorylation | 0.270534 | 1 | Thaps_hclust_0163 |
| GO:0006568 | tryptophan metabolism | 0.00865617 | 1 | Thaps_hclust_0163 |
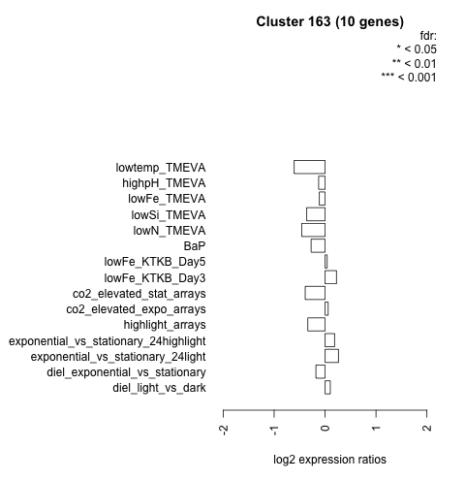
| Condition | Condition | Difference | FDR |
|---|---|---|---|
| diel_light_vs_dark | diel_light_vs_dark | 0.103 | 0.787 |
| lowFe_KTKB_Day3 | lowFe_KTKB_Day3 | 0.225 | 0.535 |
| lowFe_KTKB_Day5 | lowFe_KTKB_Day5 | 0.041 | 0.902 |
| BaP | BaP | -0.274 | 0.388 |
| exponential_vs_stationary_24highlight | exponential_vs_stationary_24highlight | 0.188 | 0.21 |
| co2_elevated_stat_arrays | co2_elevated_stat_arrays | -0.390 | 0.169 |
| lowtemp_TMEVA | lowtemp_TMEVA | -0.607 | 0.0895 |
| highpH_TMEVA | highpH_TMEVA | -0.126 | 0.6 |
| co2_elevated_expo_arrays | co2_elevated_expo_arrays | 0.060 | 0.904 |
| lowFe_TMEVA | lowFe_TMEVA | -0.114 | 0.807 |
| exponential_vs_stationary_24light | exponential_vs_stationary_24light | 0.264 | 0.563 |
| lowN_TMEVA | lowN_TMEVA | -0.458 | 0.293 |
| diel_exponential_vs_stationary | diel_exponential_vs_stationary | -0.179 | 0.498 |
| lowSi_TMEVA | lowSi_TMEVA | -0.361 | 0.638 |
| highlight_arrays | highlight_arrays | -0.340 | 0.118 |