Thaps_hclust_0164 Hierarchical Clustering
Thalassiosira pseudonana
| Cluster Plot | Conditions Plot | Dendrogram |
|---|---|---|
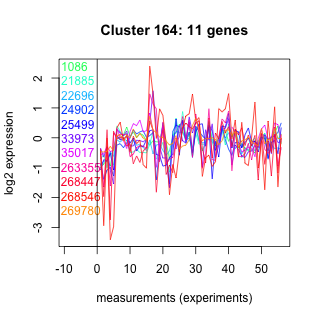 |
 |
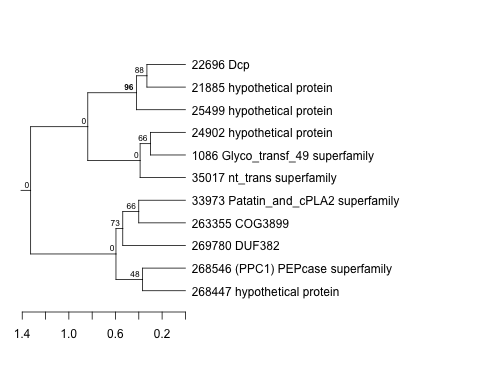 |
| GO ID | Go Term | p-value | q-value | Cluster |
|---|---|---|---|---|
| GO:0006099 | tricarboxylic acid cycle | 0.0123468 | 1 | Thaps_hclust_0164 |
| GO:0006397 | mRNA processing | 0.026995 | 1 | Thaps_hclust_0164 |
| GO:0016567 | protein ubiquitination | 0.0941262 | 1 | Thaps_hclust_0164 |
| GO:0006810 | transport | 0.207702 | 1 | Thaps_hclust_0164 |
| GO:0006118 | electron transport | 0.287914 | 1 | Thaps_hclust_0164 |
| GO:0006508 | proteolysis and peptidolysis | 0.308243 | 1 | Thaps_hclust_0164 |
| Condition | Condition | Difference | FDR |
|---|---|---|---|
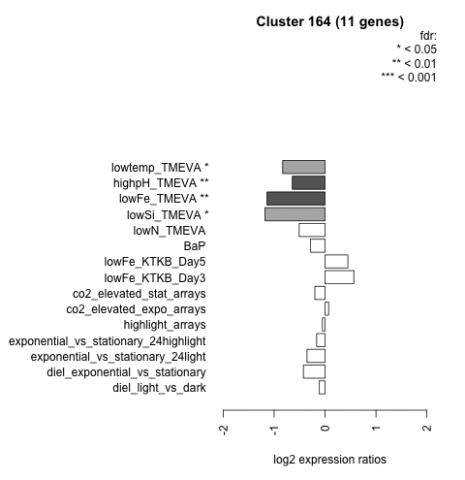
| diel_light_vs_dark | diel_light_vs_dark | -0.116 | 0.731 |
| lowFe_KTKB_Day3 | lowFe_KTKB_Day3 | 0.566 | 0.0704 |
| lowFe_KTKB_Day5 | lowFe_KTKB_Day5 | 0.448 | 0.0966 |
| BaP | BaP | -0.288 | 0.339 |
| exponential_vs_stationary_24highlight | exponential_vs_stationary_24highlight | -0.166 | 0.258 |
| co2_elevated_stat_arrays | co2_elevated_stat_arrays | -0.201 | 0.483 |
| lowtemp_TMEVA | lowtemp_TMEVA | -0.833 | 0.0199 |
| highpH_TMEVA | highpH_TMEVA | -0.643 | 0.00693 |
| co2_elevated_expo_arrays | co2_elevated_expo_arrays | 0.071 | 0.873 |
| lowFe_TMEVA | lowFe_TMEVA | -1.140 | 0.00104 |
| exponential_vs_stationary_24light | exponential_vs_stationary_24light | -0.355 | 0.399 |
| lowN_TMEVA | lowN_TMEVA | -0.509 | 0.219 |
| diel_exponential_vs_stationary | diel_exponential_vs_stationary | -0.425 | 0.0736 |
| lowSi_TMEVA | lowSi_TMEVA | -1.180 | 0.0148 |
| highlight_arrays | highlight_arrays | -0.053 | 0.822 |