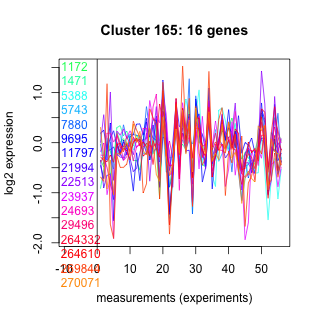
Thaps_hclust_0165 Hierarchical Clustering
Thalassiosira pseudonana
| Cluster Plot | Conditions Plot | Dendrogram |
|---|---|---|
 |
 |
 |
| GO ID | Go Term | p-value | q-value | Cluster |
|---|---|---|---|---|
| GO:0006418 | tRNA aminoacylation for protein translation | 0.0463241 | 1 | Thaps_hclust_0165 |
| GO:0006468 | protein amino acid phosphorylation | 0.164893 | 1 | Thaps_hclust_0165 |
| GO:0006118 | electron transport | 0.20254 | 1 | Thaps_hclust_0165 |
| GO:0006508 | proteolysis and peptidolysis | 0.217787 | 1 | Thaps_hclust_0165 |
|
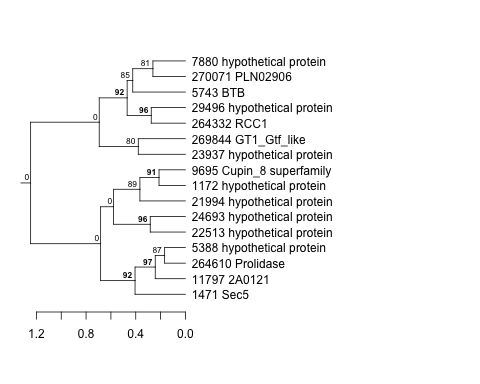
1172 : hypothetical protein |
7880 : hypothetical protein |
22513 : hypothetical protein |
264332 : RCC1 |
|
1471 : Sec5 |
9695 : Cupin_8 superfamily |
23937 : hypothetical protein |
264610 : Prolidase |
|
5388 : hypothetical protein |
11797 : 2A0121 |
24693 : hypothetical protein |
269844 : GT1_Gtf_like |
|
5743 : BTB |
21994 : hypothetical protein |
29496 : hypothetical protein |
270071 : PLN02906 |
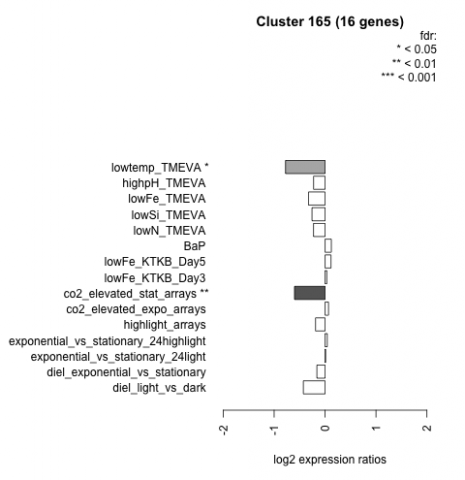
| Condition | Condition | Difference | FDR |
|---|---|---|---|
| co2_elevated_stat_arrays | co2_elevated_stat_arrays | -0.600 | 0.0067 |
| lowtemp_TMEVA | lowtemp_TMEVA | -0.777 | 0.0112 |
| diel_light_vs_dark | diel_light_vs_dark | -0.426 | 0.0516 |
| highpH_TMEVA | highpH_TMEVA | -0.226 | 0.189 |
| lowFe_TMEVA | lowFe_TMEVA | -0.325 | 0.288 |
| highlight_arrays | highlight_arrays | -0.187 | 0.303 |
| diel_exponential_vs_stationary | diel_exponential_vs_stationary | -0.160 | 0.458 |
| lowN_TMEVA | lowN_TMEVA | -0.227 | 0.564 |
| lowFe_KTKB_Day5 | lowFe_KTKB_Day5 | 0.116 | 0.63 |
| BaP | BaP | 0.123 | 0.653 |
| exponential_vs_stationary_24highlight | exponential_vs_stationary_24highlight | 0.043 | 0.751 |
| lowSi_TMEVA | lowSi_TMEVA | -0.256 | 0.806 |
| co2_elevated_expo_arrays | co2_elevated_expo_arrays | 0.068 | 0.873 |
| lowFe_KTKB_Day3 | lowFe_KTKB_Day3 | 0.034 | 0.926 |
| exponential_vs_stationary_24light | exponential_vs_stationary_24light | 0.013 | 0.982 |