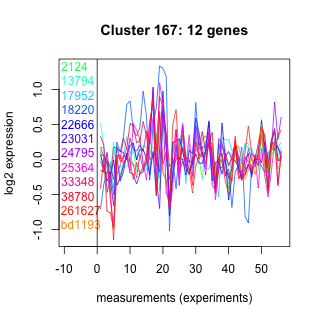
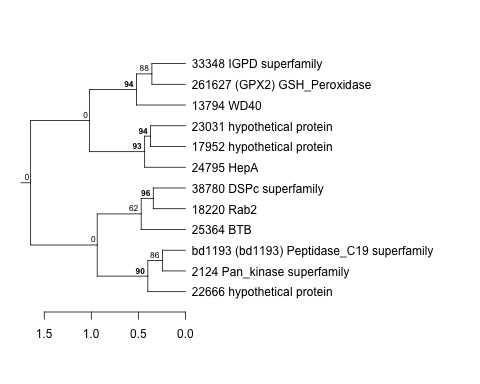
Thaps_hclust_0167 Hierarchical Clustering
Thalassiosira pseudonana
| Cluster Plot | Conditions Plot | Dendrogram |
|---|---|---|
 |
 |
 |
| GO ID | Go Term | p-value | q-value | Cluster |
|---|---|---|---|---|
| GO:0045941 | positive regulation of transcription | 0.00413095 | 1 | Thaps_hclust_0167 |
| GO:0000105 | histidine biosynthesis | 0.0164318 | 1 | Thaps_hclust_0167 |
| GO:0006979 | response to oxidative stress | 0.0485684 | 1 | Thaps_hclust_0167 |
| GO:0006470 | protein amino acid dephosphorylation | 0.0525183 | 1 | Thaps_hclust_0167 |
| GO:0000160 | two-component signal transduction system (phosphorelay) | 0.0544877 | 1 | Thaps_hclust_0167 |
| GO:0007264 | small GTPase mediated signal transduction | 0.0681707 | 1 | Thaps_hclust_0167 |
| GO:0015031 | protein transport | 0.0855012 | 1 | Thaps_hclust_0167 |
| GO:0006886 | intracellular protein transport | 0.106289 | 1 | Thaps_hclust_0167 |
| GO:0006118 | electron transport | 0.432304 | 1 | Thaps_hclust_0167 |
| GO:0006355 | regulation of transcription, DNA-dependent | 0.481263 | 1 | Thaps_hclust_0167 |
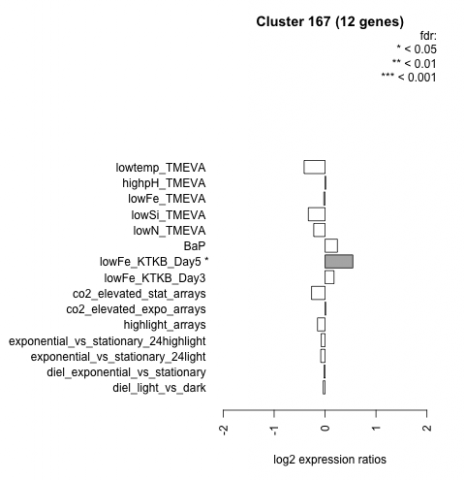
| Condition | Condition | Difference | FDR |
|---|---|---|---|
| diel_light_vs_dark | diel_light_vs_dark | -0.038 | 0.94 |
| lowFe_KTKB_Day3 | lowFe_KTKB_Day3 | 0.175 | 0.604 |
| lowFe_KTKB_Day5 | lowFe_KTKB_Day5 | 0.546 | 0.0421 |
| BaP | BaP | 0.243 | 0.398 |
| exponential_vs_stationary_24highlight | exponential_vs_stationary_24highlight | -0.076 | 0.614 |
| co2_elevated_stat_arrays | co2_elevated_stat_arrays | -0.266 | 0.329 |
| lowtemp_TMEVA | lowtemp_TMEVA | -0.411 | 0.22 |
| highpH_TMEVA | highpH_TMEVA | 0.015 | 0.971 |
| co2_elevated_expo_arrays | co2_elevated_expo_arrays | 0.014 | 0.985 |
| lowFe_TMEVA | lowFe_TMEVA | -0.024 | 0.97 |
| exponential_vs_stationary_24light | exponential_vs_stationary_24light | -0.084 | 0.862 |
| lowN_TMEVA | lowN_TMEVA | -0.222 | 0.605 |
| diel_exponential_vs_stationary | diel_exponential_vs_stationary | -0.018 | 0.958 |
| lowSi_TMEVA | lowSi_TMEVA | -0.328 | 0.688 |
| highlight_arrays | highlight_arrays | -0.149 | 0.484 |