Thaps_hclust_0176 Hierarchical Clustering
Thalassiosira pseudonana
| Cluster Plot | Conditions Plot | Dendrogram |
|---|---|---|
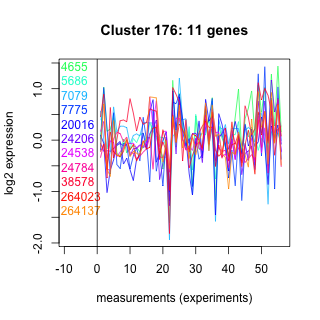 |
 |
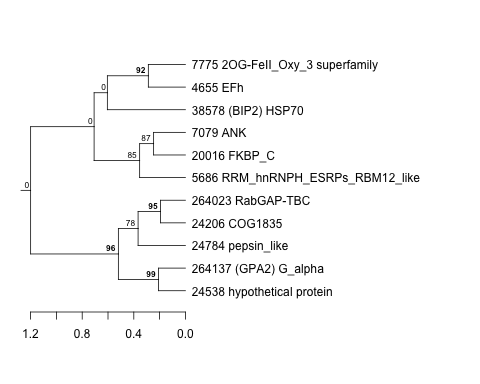 |
| GO ID | Go Term | p-value | q-value | Cluster |
|---|---|---|---|---|
| GO:0016192 | vesicle-mediated transport | 0.0131699 | 1 | Thaps_hclust_0176 |
| GO:0007186 | G-protein coupled receptor protein signaling pathway | 0.0172587 | 1 | Thaps_hclust_0176 |
| GO:0019538 | protein metabolism | 0.0375124 | 1 | Thaps_hclust_0176 |
| GO:0006457 | protein folding | 0.103279 | 1 | Thaps_hclust_0176 |
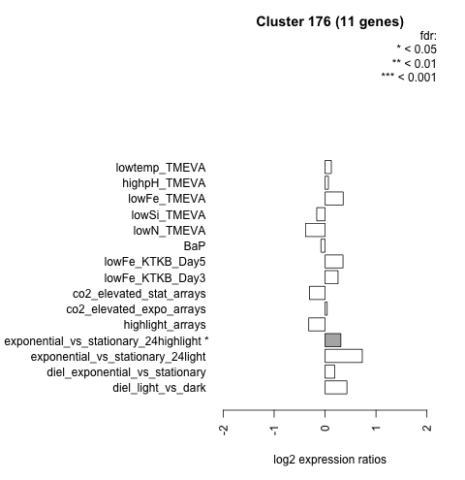
| Condition | Condition | Difference | FDR |
|---|---|---|---|
| diel_light_vs_dark | diel_light_vs_dark | 0.430 | 0.119 |
| lowFe_KTKB_Day3 | lowFe_KTKB_Day3 | 0.254 | 0.447 |
| lowFe_KTKB_Day5 | lowFe_KTKB_Day5 | 0.353 | 0.188 |
| BaP | BaP | -0.080 | 0.823 |
| exponential_vs_stationary_24highlight | exponential_vs_stationary_24highlight | 0.310 | 0.0345 |
| co2_elevated_stat_arrays | co2_elevated_stat_arrays | -0.305 | 0.28 |
| lowtemp_TMEVA | lowtemp_TMEVA | 0.123 | 0.733 |
| highpH_TMEVA | highpH_TMEVA | 0.066 | 0.794 |
| co2_elevated_expo_arrays | co2_elevated_expo_arrays | 0.040 | 0.943 |
| lowFe_TMEVA | lowFe_TMEVA | 0.357 | 0.3 |
| exponential_vs_stationary_24light | exponential_vs_stationary_24light | 0.731 | 0.0697 |
| lowN_TMEVA | lowN_TMEVA | -0.383 | 0.355 |
| diel_exponential_vs_stationary | diel_exponential_vs_stationary | 0.190 | 0.449 |
| lowSi_TMEVA | lowSi_TMEVA | -0.164 | 0.929 |
| highlight_arrays | highlight_arrays | -0.322 | 0.129 |