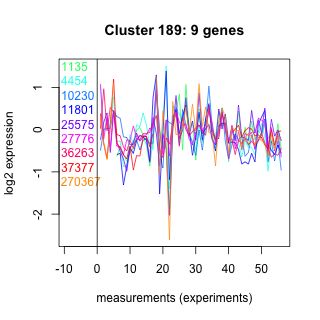
Thaps_hclust_0189 Hierarchical Clustering
Thalassiosira pseudonana
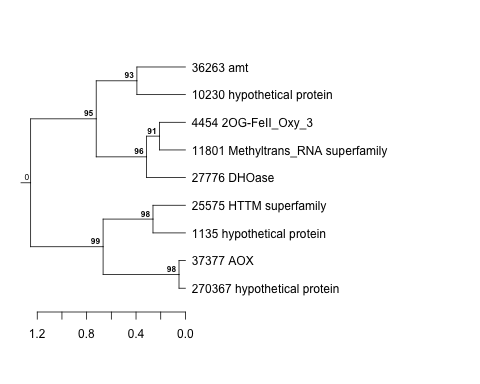
| Cluster Plot | Conditions Plot | Dendrogram |
|---|---|---|
 |
 |
 |
| GO ID | Go Term | p-value | q-value | Cluster |
|---|---|---|---|---|
| GO:0019856 | pyrimidine base biosynthesis | 0.00185989 | 1 | Thaps_hclust_0189 |
| GO:0019538 | protein metabolism | 0.0282654 | 1 | Thaps_hclust_0189 |
| GO:0006810 | transport | 0.109856 | 1 | Thaps_hclust_0189 |
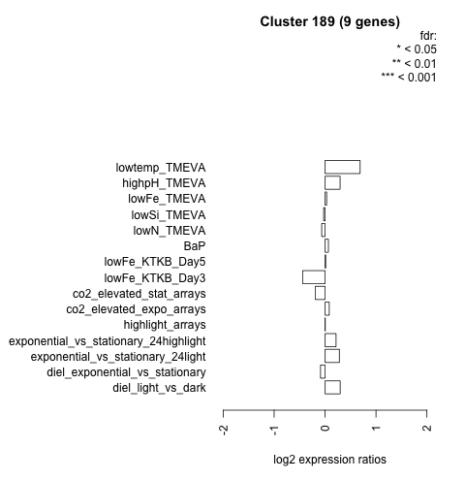
| Condition | Condition | Difference | FDR |
|---|---|---|---|
| diel_light_vs_dark | diel_light_vs_dark | 0.298 | 0.367 |
| lowFe_KTKB_Day3 | lowFe_KTKB_Day3 | -0.440 | 0.206 |
| lowFe_KTKB_Day5 | lowFe_KTKB_Day5 | 0.014 | 0.968 |
| BaP | BaP | 0.066 | 0.865 |
| exponential_vs_stationary_24highlight | exponential_vs_stationary_24highlight | 0.215 | 0.175 |
| co2_elevated_stat_arrays | co2_elevated_stat_arrays | -0.192 | 0.533 |
| lowtemp_TMEVA | lowtemp_TMEVA | 0.687 | 0.0829 |
| highpH_TMEVA | highpH_TMEVA | 0.295 | 0.182 |
| co2_elevated_expo_arrays | co2_elevated_expo_arrays | 0.082 | 0.848 |
| lowFe_TMEVA | lowFe_TMEVA | 0.032 | 0.951 |
| exponential_vs_stationary_24light | exponential_vs_stationary_24light | 0.282 | 0.562 |
| lowN_TMEVA | lowN_TMEVA | -0.066 | 0.866 |
| diel_exponential_vs_stationary | diel_exponential_vs_stationary | -0.090 | 0.779 |
| lowSi_TMEVA | lowSi_TMEVA | -0.028 | 1 |
| highlight_arrays | highlight_arrays | 0.003 | 0.988 |