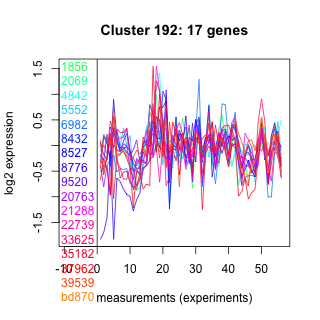
Thaps_hclust_0192 Hierarchical Clustering
Thalassiosira pseudonana
| Cluster Plot | Conditions Plot | Dendrogram |
|---|---|---|
 |
 |
 |
| GO ID | Go Term | p-value | q-value | Cluster |
|---|---|---|---|---|
| GO:0016481 | negative regulation of transcription | 0.00289256 | 1 | Thaps_hclust_0192 |
| GO:0006304 | DNA modification | 0.00433615 | 1 | Thaps_hclust_0192 |
| GO:0006268 | DNA unwinding | 0.00721795 | 1 | Thaps_hclust_0192 |
| GO:0006265 | DNA topological change | 0.0143912 | 1 | Thaps_hclust_0192 |
| GO:0006397 | mRNA processing | 0.031426 | 1 | Thaps_hclust_0192 |
| GO:0006810 | transport | 0.237879 | 1 | Thaps_hclust_0192 |
| GO:0006468 | protein amino acid phosphorylation | 0.270534 | 1 | Thaps_hclust_0192 |
|
1856 : hypothetical protein |
8432 : TAF7 |
20763 : CAF1 |
35182 : SET |
|
2069 : hypothetical protein |
8527 : hypothetical protein |
21288 : dsDNA_bind |
37962 : LSm3 |
|
4842 : Cas1_AcylT superfamily |
8776 : Methyltransf_16 superfamily |
22739 : hypothetical protein |
39539 : Pkinase |
|
5552 : hypothetical protein |
9520 : ANK |
33625 : (top3a) TopA |
bd870 : (bd870) LRR_RI superfamily |
|
6982 : hypothetical protein |
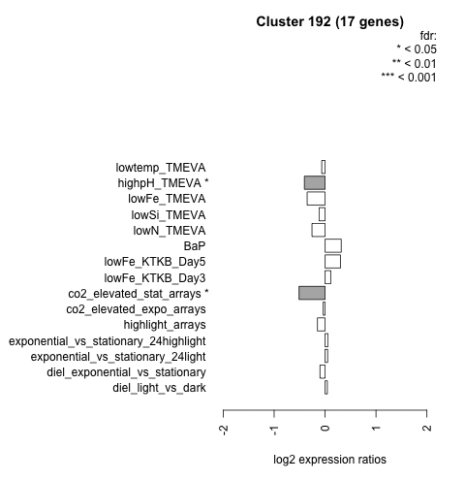
| Condition | Condition | Difference | FDR |
|---|---|---|---|
| diel_light_vs_dark | diel_light_vs_dark | 0.045 | 0.902 |
| lowFe_KTKB_Day3 | lowFe_KTKB_Day3 | 0.112 | 0.722 |
| lowFe_KTKB_Day5 | lowFe_KTKB_Day5 | 0.303 | 0.156 |
| BaP | BaP | 0.318 | 0.183 |
| exponential_vs_stationary_24highlight | exponential_vs_stationary_24highlight | 0.058 | 0.657 |
| co2_elevated_stat_arrays | co2_elevated_stat_arrays | -0.511 | 0.025 |
| lowtemp_TMEVA | lowtemp_TMEVA | -0.065 | 0.844 |
| highpH_TMEVA | highpH_TMEVA | -0.406 | 0.021 |
| co2_elevated_expo_arrays | co2_elevated_expo_arrays | -0.038 | 0.943 |
| lowFe_TMEVA | lowFe_TMEVA | -0.351 | 0.232 |
| exponential_vs_stationary_24light | exponential_vs_stationary_24light | 0.052 | 0.9 |
| lowN_TMEVA | lowN_TMEVA | -0.257 | 0.489 |
| diel_exponential_vs_stationary | diel_exponential_vs_stationary | -0.099 | 0.664 |
| lowSi_TMEVA | lowSi_TMEVA | -0.116 | 0.976 |
| highlight_arrays | highlight_arrays | -0.150 | 0.407 |