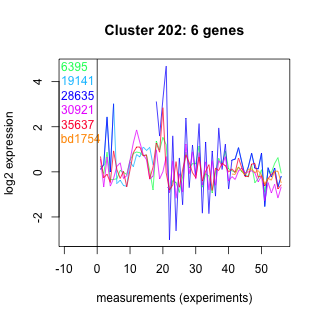
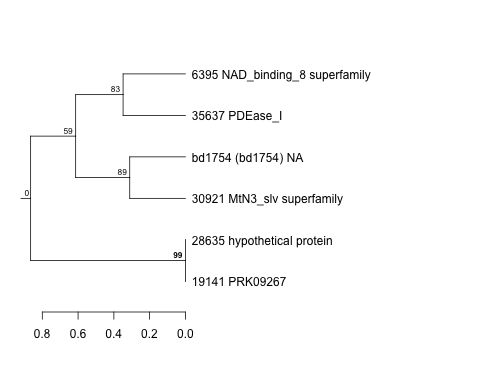
Thaps_hclust_0202 Hierarchical Clustering
Thalassiosira pseudonana
| Cluster Plot | Conditions Plot | Dendrogram |
|---|---|---|
 |
 |
 |
| GO ID | Go Term | p-value | q-value | Cluster |
|---|---|---|---|---|
| GO:0006725 | aromatic compound metabolism | 0.0225447 | 1 | Thaps_hclust_0202 |
| GO:0006118 | electron transport | 0.0269761 | 1 | Thaps_hclust_0202 |
| GO:0007165 | signal transduction | 0.0406863 | 1 | Thaps_hclust_0202 |
| GO:0008152 | metabolism | 0.355748 | 1 | Thaps_hclust_0202 |
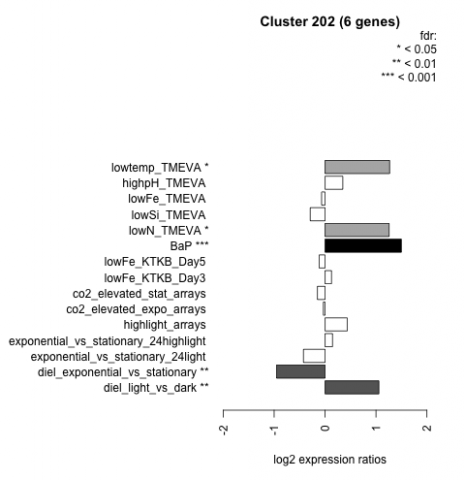
| Condition | Condition | Difference | FDR |
|---|---|---|---|
| diel_light_vs_dark | diel_light_vs_dark | 1.060 | 0.00516 |
| lowFe_KTKB_Day3 | lowFe_KTKB_Day3 | 0.127 | 0.795 |
| lowFe_KTKB_Day5 | lowFe_KTKB_Day5 | -0.115 | 0.766 |
| BaP | BaP | 1.500 | 0.00037 |
| exponential_vs_stationary_24highlight | exponential_vs_stationary_24highlight | 0.147 | 0.46 |
| co2_elevated_stat_arrays | co2_elevated_stat_arrays | -0.151 | 0.697 |
| lowtemp_TMEVA | lowtemp_TMEVA | 1.270 | 0.0174 |
| highpH_TMEVA | highpH_TMEVA | 0.348 | 0.194 |
| co2_elevated_expo_arrays | co2_elevated_expo_arrays | -0.034 | 0.968 |
| lowFe_TMEVA | lowFe_TMEVA | -0.068 | 0.888 |
| exponential_vs_stationary_24light | exponential_vs_stationary_24light | -0.424 | 0.454 |
| lowN_TMEVA | lowN_TMEVA | 1.260 | 0.0333 |
| diel_exponential_vs_stationary | diel_exponential_vs_stationary | -0.953 | 0.00732 |
| lowSi_TMEVA | lowSi_TMEVA | -0.291 | 0.806 |
| highlight_arrays | highlight_arrays | 0.436 | 0.128 |