|
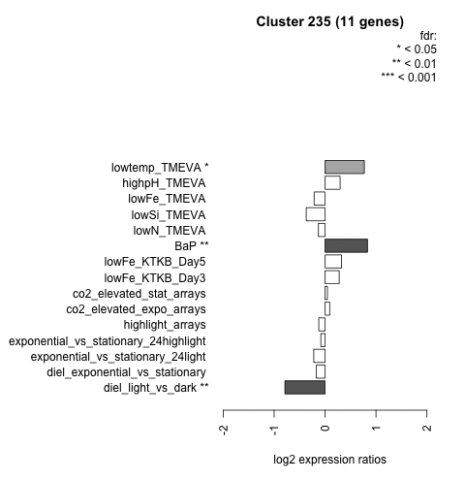
diel_light_vs_dark |
diel_light_vs_dark |
-0.789 |
0.00451 |
|
lowFe_KTKB_Day3 |
lowFe_KTKB_Day3 |
0.278 |
0.405 |
|
lowFe_KTKB_Day5 |
lowFe_KTKB_Day5 |
0.322 |
0.234 |
|
BaP |
BaP |
0.834 |
0.00457 |
|
exponential_vs_stationary_24highlight |
exponential_vs_stationary_24highlight |
-0.082 |
0.602 |
|
co2_elevated_stat_arrays |
co2_elevated_stat_arrays |
0.047 |
0.887 |
|
lowtemp_TMEVA |
lowtemp_TMEVA |
0.771 |
0.031 |
|
highpH_TMEVA |
highpH_TMEVA |
0.296 |
0.15 |
|
co2_elevated_expo_arrays |
co2_elevated_expo_arrays |
0.092 |
0.802 |
|
lowFe_TMEVA |
lowFe_TMEVA |
-0.213 |
0.549 |
|
exponential_vs_stationary_24light |
exponential_vs_stationary_24light |
-0.222 |
0.623 |
|
lowN_TMEVA |
lowN_TMEVA |
-0.132 |
0.761 |
|
diel_exponential_vs_stationary |
diel_exponential_vs_stationary |
-0.171 |
0.498 |
|
lowSi_TMEVA |
lowSi_TMEVA |
-0.369 |
0.613 |
|
highlight_arrays |
highlight_arrays |
-0.123 |
0.59 |