Thaps_hclust_0240 Hierarchical Clustering
Thalassiosira pseudonana
| Cluster Plot | Conditions Plot | Dendrogram |
|---|---|---|
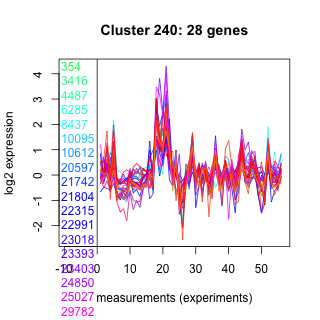 |
 |
 |
| GO ID | Go Term | p-value | q-value | Cluster |
|---|---|---|---|---|
| GO:0006457 | protein folding | 0.000962412 | 1 | Thaps_hclust_0240 |
| GO:0006351 | transcription, DNA-dependent | 0.00165392 | 1 | Thaps_hclust_0240 |
| GO:0006396 | RNA processing | 0.00377782 | 1 | Thaps_hclust_0240 |
| GO:0006413 | translational initiation | 0.0390393 | 1 | Thaps_hclust_0240 |
| GO:0008152 | metabolism | 0.505245 | 1 | Thaps_hclust_0240 |
|
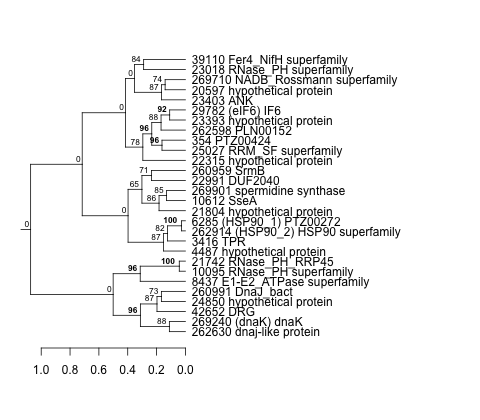
354 : PTZ00424 |
20597 : hypothetical protein |
23403 : ANK |
260991 : DnaJ_bact |
|
3416 : TPR |
21742 : RNase_PH_RRP45 |
24850 : hypothetical protein |
262598 : PLN00152 |
|
4487 : hypothetical protein |
21804 : hypothetical protein |
25027 : RRM_SF superfamily |
262630 : dnaj-like protein |
|
6285 : (HSP90_1) PTZ00272 |
22315 : hypothetical protein |
29782 : (eIF6) IF6 |
262914 : (HSP90_2) HSP90 superfamily |
|
8437 : E1-E2_ATPase superfamily |
22991 : DUF2040 |
39110 : Fer4_NifH superfamily |
269240 : (dnaK) dnaK |
|
10095 : RNase_PH superfamily |
23018 : RNase_PH superfamily |
42652 : DRG |
269710 : NADB_Rossmann superfamily |
|
10612 : SseA |
23393 : hypothetical protein |
260959 : SrmB |
269901 : spermidine synthase |
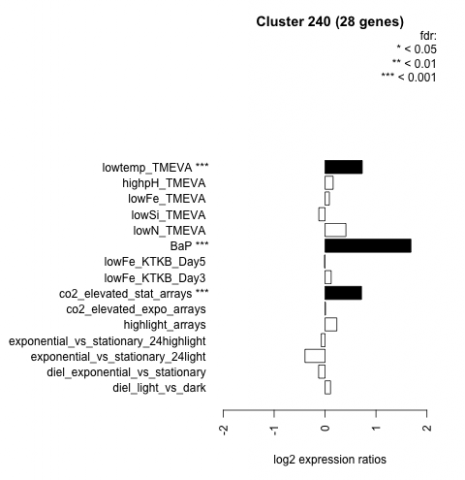
| Condition | Condition | Difference | FDR |
|---|---|---|---|
| diel_light_vs_dark | diel_light_vs_dark | 0.108 | 0.626 |
| lowFe_KTKB_Day3 | lowFe_KTKB_Day3 | 0.119 | 0.601 |
| lowFe_KTKB_Day5 | lowFe_KTKB_Day5 | -0.011 | 0.964 |
| BaP | BaP | 1.690 | 0.00037 |
| exponential_vs_stationary_24highlight | exponential_vs_stationary_24highlight | -0.075 | 0.434 |
| co2_elevated_stat_arrays | co2_elevated_stat_arrays | 0.716 | 0.000658 |
| lowtemp_TMEVA | lowtemp_TMEVA | 0.731 | 0.000735 |
| highpH_TMEVA | highpH_TMEVA | 0.158 | 0.257 |
| co2_elevated_expo_arrays | co2_elevated_expo_arrays | 0.009 | 0.985 |
| lowFe_TMEVA | lowFe_TMEVA | 0.084 | 0.823 |
| exponential_vs_stationary_24light | exponential_vs_stationary_24light | -0.395 | 0.145 |
| lowN_TMEVA | lowN_TMEVA | 0.410 | 0.13 |
| diel_exponential_vs_stationary | diel_exponential_vs_stationary | -0.127 | 0.456 |
| lowSi_TMEVA | lowSi_TMEVA | -0.122 | 0.976 |
| highlight_arrays | highlight_arrays | 0.230 | 0.0882 |