Thaps_hclust_0279 Hierarchical Clustering
Thalassiosira pseudonana
| Cluster Plot | Conditions Plot | Dendrogram |
|---|---|---|
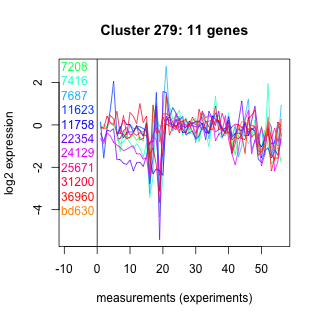 |
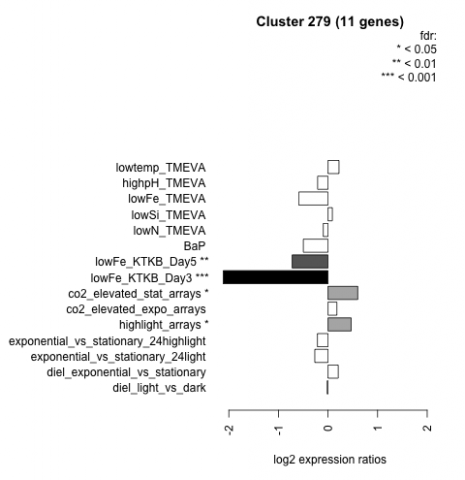 |
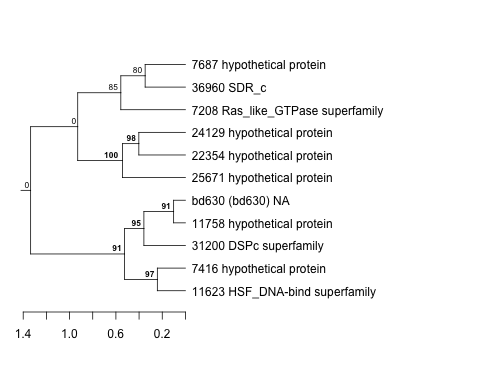 |
| GO ID | Go Term | p-value | q-value | Cluster |
|---|---|---|---|---|
| GO:0006470 | protein amino acid dephosphorylation | 0.0318373 | 1 | Thaps_hclust_0279 |
| GO:0007264 | small GTPase mediated signal transduction | 0.0414617 | 1 | Thaps_hclust_0279 |
| GO:0015031 | protein transport | 0.0521938 | 1 | Thaps_hclust_0279 |
| GO:0008152 | metabolism | 0.0844211 | 1 | Thaps_hclust_0279 |
| GO:0006355 | regulation of transcription, DNA-dependent | 0.325408 | 1 | Thaps_hclust_0279 |
| Condition | Condition | Difference | FDR |
|---|---|---|---|
| diel_light_vs_dark | diel_light_vs_dark | -0.018 | 0.969 |
| lowFe_KTKB_Day3 | lowFe_KTKB_Day3 | -2.110 | 0.000862 |
| lowFe_KTKB_Day5 | lowFe_KTKB_Day5 | -0.723 | 0.00686 |
| BaP | BaP | -0.497 | 0.0816 |
| exponential_vs_stationary_24highlight | exponential_vs_stationary_24highlight | -0.214 | 0.136 |
| co2_elevated_stat_arrays | co2_elevated_stat_arrays | 0.600 | 0.0287 |
| lowtemp_TMEVA | lowtemp_TMEVA | 0.221 | 0.509 |
| highpH_TMEVA | highpH_TMEVA | -0.210 | 0.319 |
| co2_elevated_expo_arrays | co2_elevated_expo_arrays | 0.178 | 0.443 |
| lowFe_TMEVA | lowFe_TMEVA | -0.590 | 0.0909 |
| exponential_vs_stationary_24light | exponential_vs_stationary_24light | -0.267 | 0.545 |
| lowN_TMEVA | lowN_TMEVA | -0.096 | 0.828 |
| diel_exponential_vs_stationary | diel_exponential_vs_stationary | 0.206 | 0.399 |
| lowSi_TMEVA | lowSi_TMEVA | 0.088 | 0.997 |
| highlight_arrays | highlight_arrays | 0.467 | 0.0267 |