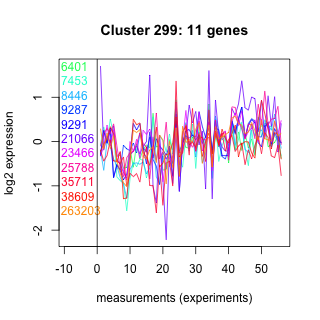
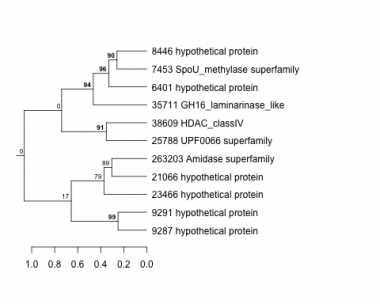
Thaps_hclust_0299 Hierarchical Clustering
Thalassiosira pseudonana
| GO ID | Go Term | p-value | q-value | Cluster |
|---|---|---|---|---|
| GO:0005975 | carbohydrate metabolism | 0.0155055 | 1 | Thaps_hclust_0299 |
|
6401 : hypothetical protein |
9287 : hypothetical protein |
23466 : hypothetical protein |
38609 : HDAC_classIV |
|
7453 : SpoU_methylase superfamily |
9291 : hypothetical protein |
25788 : UPF0066 superfamily |
263203 : Amidase superfamily |
|
8446 : hypothetical protein |
21066 : hypothetical protein |
35711 : GH16_laminarinase_like |
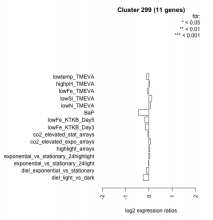
| Condition | Condition | Difference | FDR |
|---|---|---|---|
| diel_light_vs_dark | diel_light_vs_dark | -0.249 | 0.415 |
| lowFe_KTKB_Day3 | lowFe_KTKB_Day3 | -0.156 | 0.649 |
| lowFe_KTKB_Day5 | lowFe_KTKB_Day5 | -0.172 | 0.542 |
| BaP | BaP | -0.439 | 0.125 |
| exponential_vs_stationary_24highlight | exponential_vs_stationary_24highlight | 0.043 | 0.79 |
| co2_elevated_stat_arrays | co2_elevated_stat_arrays | -0.043 | 0.892 |
| lowtemp_TMEVA | lowtemp_TMEVA | -0.096 | 0.799 |
| highpH_TMEVA | highpH_TMEVA | 0.025 | 0.943 |
| co2_elevated_expo_arrays | co2_elevated_expo_arrays | 0.069 | 0.873 |
| lowFe_TMEVA | lowFe_TMEVA | -0.061 | 0.888 |
| exponential_vs_stationary_24light | exponential_vs_stationary_24light | -0.012 | 0.984 |
| lowN_TMEVA | lowN_TMEVA | 0.064 | 0.861 |
| diel_exponential_vs_stationary | diel_exponential_vs_stationary | -0.103 | 0.71 |
| lowSi_TMEVA | lowSi_TMEVA | 0.120 | 0.976 |
| highlight_arrays | highlight_arrays | 0.041 | 0.86 |


