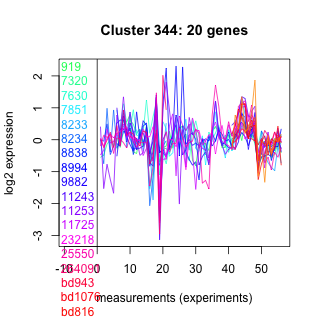
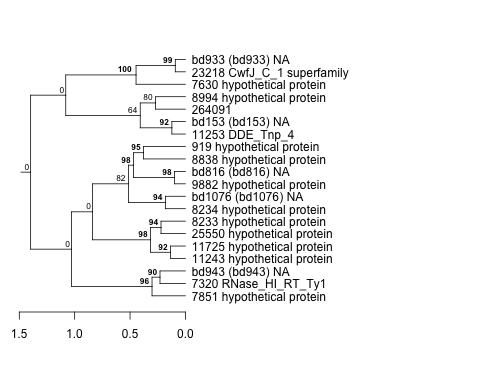
Thaps_hclust_0344 Hierarchical Clustering
Thalassiosira pseudonana
| Cluster Plot | Conditions Plot | Dendrogram |
|---|---|---|
 |
 |
 |
| GO ID | Go Term | p-value | q-value | Cluster |
|---|---|---|---|---|
| GO:0009401 | phosphoenolpyruvate-dependent sugar phosphotransferase system | 0.0184762 | 1 | Thaps_hclust_0344 |
| GO:0006310 | DNA recombination | 0.0194946 | 1 | Thaps_hclust_0344 |
| GO:0006468 | protein amino acid phosphorylation | 0.201698 | 1 | Thaps_hclust_0344 |
| GO:0006355 | regulation of transcription, DNA-dependent | 0.27964 | 1 | Thaps_hclust_0344 |
| GO:0008152 | metabolism | 0.355748 | 1 | Thaps_hclust_0344 |
|
919 : hypothetical protein |
8234 : hypothetical protein |
11253 : DDE_Tnp_4 |
bd943 : (bd943) NA |
|
7320 : RNase_HI_RT_Ty1 |
8838 : hypothetical protein |
11725 : hypothetical protein |
bd1076 : (bd1076) NA |
|
7630 : hypothetical protein |
8994 : hypothetical protein |
23218 : CwfJ_C_1 superfamily |
bd816 : (bd816) NA |
|
7851 : hypothetical protein |
9882 : hypothetical protein |
25550 : hypothetical protein |
bd153 : (bd153) NA |
|
8233 : hypothetical protein |
11243 : hypothetical protein |
264091 : |
bd933 : (bd933) NA |
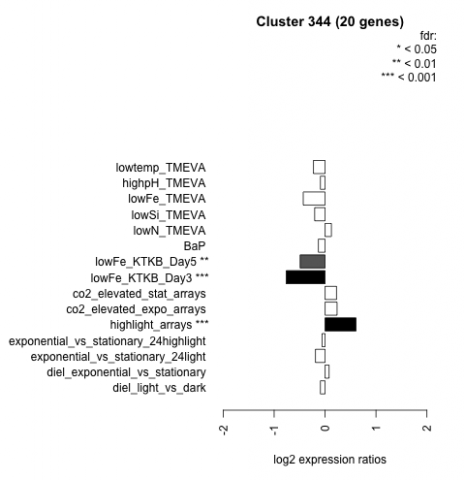
| Condition | Condition | Difference | FDR |
|---|---|---|---|
| diel_light_vs_dark | diel_light_vs_dark | -0.092 | 0.726 |
| lowFe_KTKB_Day3 | lowFe_KTKB_Day3 | -0.762 | 0.000862 |
| lowFe_KTKB_Day5 | lowFe_KTKB_Day5 | -0.490 | 0.00818 |
| BaP | BaP | -0.132 | 0.587 |
| exponential_vs_stationary_24highlight | exponential_vs_stationary_24highlight | -0.058 | 0.633 |
| co2_elevated_stat_arrays | co2_elevated_stat_arrays | 0.226 | 0.338 |
| lowtemp_TMEVA | lowtemp_TMEVA | -0.228 | 0.38 |
| highpH_TMEVA | highpH_TMEVA | -0.092 | 0.609 |
| co2_elevated_expo_arrays | co2_elevated_expo_arrays | 0.236 | 0.107 |
| lowFe_TMEVA | lowFe_TMEVA | -0.429 | 0.0921 |
| exponential_vs_stationary_24light | exponential_vs_stationary_24light | -0.189 | 0.604 |
| lowN_TMEVA | lowN_TMEVA | 0.125 | 0.761 |
| diel_exponential_vs_stationary | diel_exponential_vs_stationary | 0.078 | 0.716 |
| lowSi_TMEVA | lowSi_TMEVA | -0.204 | 0.854 |
| highlight_arrays | highlight_arrays | 0.607 | 0.000442 |