Thaps_hclust_0345 Hierarchical Clustering
Thalassiosira pseudonana
| Cluster Plot | Conditions Plot | Dendrogram |
|---|---|---|
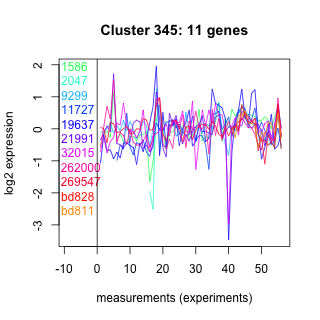 |
 |
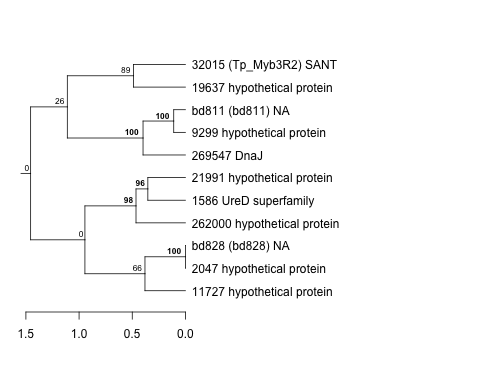 |
| GO ID | Go Term | p-value | q-value | Cluster |
|---|---|---|---|---|
| GO:0000074 | regulation of cell cycle | 0.0246574 | 1 | Thaps_hclust_0345 |
| GO:0006457 | protein folding | 0.0530354 | 1 | Thaps_hclust_0345 |
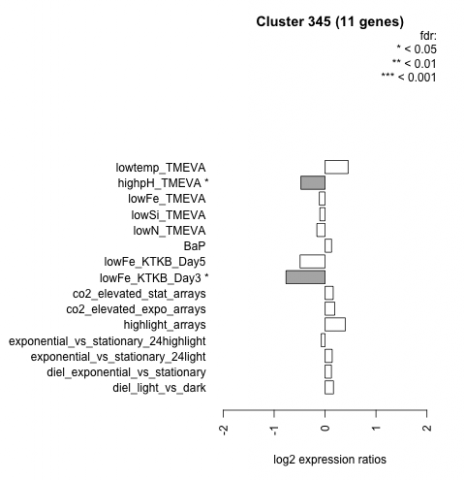
| Condition | Condition | Difference | FDR |
|---|---|---|---|
| diel_light_vs_dark | diel_light_vs_dark | 0.166 | 0.625 |
| lowFe_KTKB_Day3 | lowFe_KTKB_Day3 | -0.766 | 0.0135 |
| lowFe_KTKB_Day5 | lowFe_KTKB_Day5 | -0.491 | 0.0716 |
| BaP | BaP | 0.128 | 0.697 |
| exponential_vs_stationary_24highlight | exponential_vs_stationary_24highlight | -0.075 | 0.633 |
| co2_elevated_stat_arrays | co2_elevated_stat_arrays | 0.160 | 0.59 |
| lowtemp_TMEVA | lowtemp_TMEVA | 0.454 | 0.186 |
| highpH_TMEVA | highpH_TMEVA | -0.475 | 0.0241 |
| co2_elevated_expo_arrays | co2_elevated_expo_arrays | 0.189 | 0.412 |
| lowFe_TMEVA | lowFe_TMEVA | -0.113 | 0.795 |
| exponential_vs_stationary_24light | exponential_vs_stationary_24light | 0.140 | 0.787 |
| lowN_TMEVA | lowN_TMEVA | -0.160 | 0.716 |
| diel_exponential_vs_stationary | diel_exponential_vs_stationary | 0.125 | 0.639 |
| lowSi_TMEVA | lowSi_TMEVA | -0.101 | 0.984 |
| highlight_arrays | highlight_arrays | 0.398 | 0.0556 |