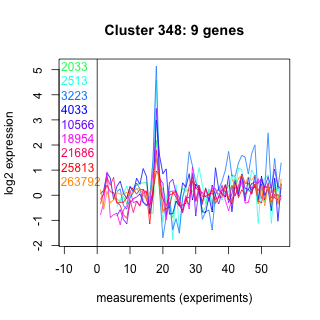
Thaps_hclust_0348 Hierarchical Clustering
Thalassiosira pseudonana
| Cluster Plot | Conditions Plot | Dendrogram |
|---|---|---|
 |
 |
 |
| GO ID | Go Term | p-value | q-value | Cluster |
|---|---|---|---|---|
| GO:0009116 | nucleoside metabolism | 0.00247959 | 1 | Thaps_hclust_0348 |
| GO:0006118 | electron transport | 0.106972 | 1 | Thaps_hclust_0348 |
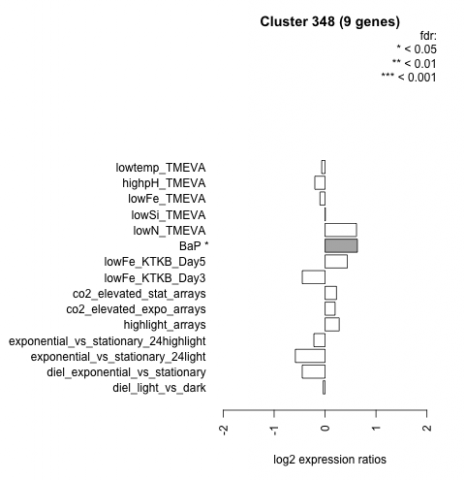
| Condition | Condition | Difference | FDR |
|---|---|---|---|
| diel_light_vs_dark | diel_light_vs_dark | -0.038 | 0.952 |
| lowFe_KTKB_Day3 | lowFe_KTKB_Day3 | -0.447 | 0.2 |
| lowFe_KTKB_Day5 | lowFe_KTKB_Day5 | 0.437 | 0.146 |
| BaP | BaP | 0.635 | 0.0423 |
| exponential_vs_stationary_24highlight | exponential_vs_stationary_24highlight | -0.219 | 0.166 |
| co2_elevated_stat_arrays | co2_elevated_stat_arrays | 0.225 | 0.468 |
| lowtemp_TMEVA | lowtemp_TMEVA | -0.066 | 0.884 |
| highpH_TMEVA | highpH_TMEVA | -0.201 | 0.376 |
| co2_elevated_expo_arrays | co2_elevated_expo_arrays | 0.197 | 0.443 |
| lowFe_TMEVA | lowFe_TMEVA | -0.100 | 0.836 |
| exponential_vs_stationary_24light | exponential_vs_stationary_24light | -0.584 | 0.18 |
| lowN_TMEVA | lowN_TMEVA | 0.618 | 0.179 |
| diel_exponential_vs_stationary | diel_exponential_vs_stationary | -0.448 | 0.0949 |
| lowSi_TMEVA | lowSi_TMEVA | 0.005 | 1 |
| highlight_arrays | highlight_arrays | 0.278 | 0.239 |