Thaps_hclust_0356 Hierarchical Clustering
Thalassiosira pseudonana
| Cluster Plot | Conditions Plot | Dendrogram |
|---|---|---|
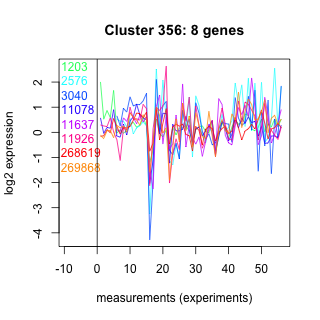 |
 |
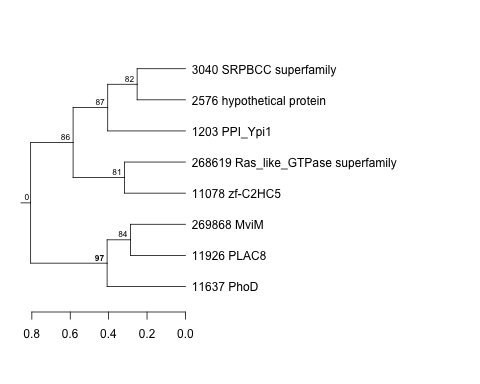 |
| GO ID | Go Term | p-value | q-value | Cluster |
|---|---|---|---|---|
| GO:0007264 | small GTPase mediated signal transduction | 0.0278301 | 1 | Thaps_hclust_0356 |
| GO:0008152 | metabolism | 0.0377993 | 1 | Thaps_hclust_0356 |
| GO:0006118 | electron transport | 0.20254 | 1 | Thaps_hclust_0356 |
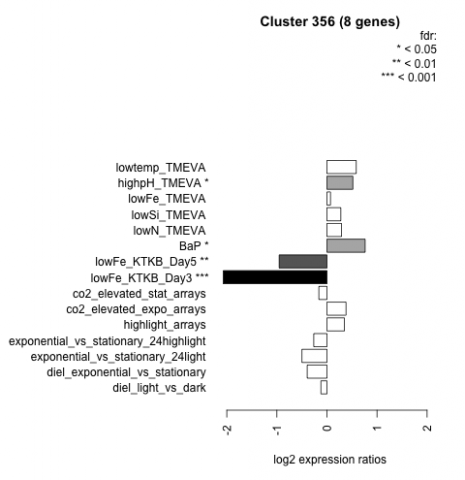
| Condition | Condition | Difference | FDR |
|---|---|---|---|
| diel_light_vs_dark | diel_light_vs_dark | -0.120 | 0.781 |
| lowFe_KTKB_Day3 | lowFe_KTKB_Day3 | -2.070 | 0.000862 |
| lowFe_KTKB_Day5 | lowFe_KTKB_Day5 | -0.954 | 0.00893 |
| BaP | BaP | 0.763 | 0.0249 |
| exponential_vs_stationary_24highlight | exponential_vs_stationary_24highlight | -0.264 | 0.112 |
| co2_elevated_stat_arrays | co2_elevated_stat_arrays | -0.161 | 0.626 |
| lowtemp_TMEVA | lowtemp_TMEVA | 0.584 | 0.146 |
| highpH_TMEVA | highpH_TMEVA | 0.518 | 0.0388 |
| co2_elevated_expo_arrays | co2_elevated_expo_arrays | 0.382 | 0.0688 |
| lowFe_TMEVA | lowFe_TMEVA | 0.071 | 0.886 |
| exponential_vs_stationary_24light | exponential_vs_stationary_24light | -0.500 | 0.291 |
| lowN_TMEVA | lowN_TMEVA | 0.291 | 0.524 |
| diel_exponential_vs_stationary | diel_exponential_vs_stationary | -0.394 | 0.169 |
| lowSi_TMEVA | lowSi_TMEVA | 0.277 | 0.806 |
| highlight_arrays | highlight_arrays | 0.348 | 0.153 |