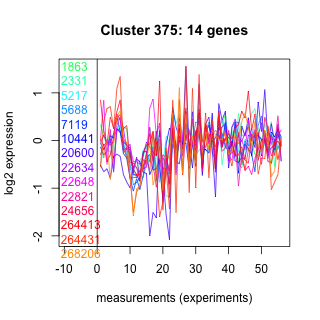
Thaps_hclust_0375 Hierarchical Clustering
Thalassiosira pseudonana
| GO ID | Go Term | p-value | q-value | Cluster |
|---|---|---|---|---|
| GO:0006333 | chromatin assembly or disassembly | 0.00412967 | 1 | Thaps_hclust_0375 |
| GO:0006260 | DNA replication | 0.0356742 | 1 | Thaps_hclust_0375 |
| GO:0016567 | protein ubiquitination | 0.0790695 | 1 | Thaps_hclust_0375 |
| GO:0006457 | protein folding | 0.127399 | 1 | Thaps_hclust_0375 |
| GO:0006508 | proteolysis and peptidolysis | 0.264399 | 1 | Thaps_hclust_0375 |
|
1863 : hypothetical protein |
7119 : pepsin_retropepsin_like superfamily |
22648 : hypothetical protein |
264413 : UPF0029 |
|
2331 : hypothetical protein |
10441 : hypothetical protein |
22821 : hypothetical protein |
264431 : Steroid_dh superfamily |
|
5217 : hypothetical protein |
20600 : hypothetical protein |
24656 : U-box superfamily |
268206 : hypothetical protein |
|
5688 : hypothetical protein |
22634 : hypothetical protein |
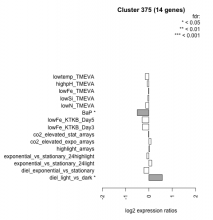
| Condition | Condition | Difference | FDR |
|---|---|---|---|
| diel_light_vs_dark | diel_light_vs_dark | 0.575 | 0.0152 |
| lowFe_KTKB_Day3 | lowFe_KTKB_Day3 | -0.273 | 0.353 |
| lowFe_KTKB_Day5 | lowFe_KTKB_Day5 | -0.291 | 0.239 |
| BaP | BaP | -0.499 | 0.0444 |
| exponential_vs_stationary_24highlight | exponential_vs_stationary_24highlight | -0.089 | 0.517 |
| co2_elevated_stat_arrays | co2_elevated_stat_arrays | -0.018 | 0.951 |
| lowtemp_TMEVA | lowtemp_TMEVA | -0.156 | 0.619 |
| highpH_TMEVA | highpH_TMEVA | -0.071 | 0.758 |
| co2_elevated_expo_arrays | co2_elevated_expo_arrays | 0.091 | 0.796 |
| lowFe_TMEVA | lowFe_TMEVA | -0.017 | 0.978 |
| exponential_vs_stationary_24light | exponential_vs_stationary_24light | 0.123 | 0.8 |
| lowN_TMEVA | lowN_TMEVA | -0.134 | 0.761 |
| diel_exponential_vs_stationary | diel_exponential_vs_stationary | -0.213 | 0.349 |
| lowSi_TMEVA | lowSi_TMEVA | -0.046 | 1 |
| highlight_arrays | highlight_arrays | 0.037 | 0.86 |


