Thaps_hclust_0380 Hierarchical Clustering
Thalassiosira pseudonana
| GO ID | Go Term | p-value | q-value | Cluster |
|---|---|---|---|---|
| GO:0009401 | phosphoenolpyruvate-dependent sugar phosphotransferase system | 0.0184762 | 1 | Thaps_hclust_0380 |
| GO:0006629 | lipid metabolism | 0.0296321 | 1 | Thaps_hclust_0380 |
| GO:0009058 | biosynthesis | 0.0555976 | 1 | Thaps_hclust_0380 |
| GO:0008152 | metabolism | 0.0595321 | 1 | Thaps_hclust_0380 |
|
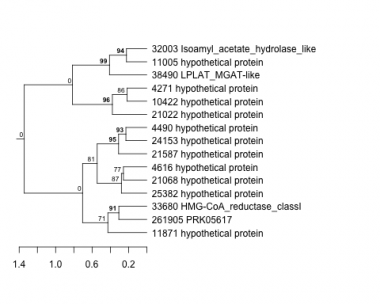
4271 : hypothetical protein |
11005 : hypothetical protein |
21587 : hypothetical protein |
33680 : HMG-CoA_reductase_classI |
|
4490 : hypothetical protein |
11871 : hypothetical protein |
24153 : hypothetical protein |
38490 : LPLAT_MGAT-like |
|
4616 : hypothetical protein |
21022 : hypothetical protein |
25382 : hypothetical protein |
261905 : PRK05617 |
|
10422 : hypothetical protein |
21068 : hypothetical protein |
32003 : Isoamyl_acetate_hydrolase_like |
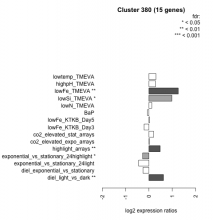
| Condition | Condition | Difference | FDR |
|---|---|---|---|
| diel_light_vs_dark | diel_light_vs_dark | 0.624 | 0.00484 |
| lowFe_KTKB_Day3 | lowFe_KTKB_Day3 | -0.207 | 0.478 |
| lowFe_KTKB_Day5 | lowFe_KTKB_Day5 | 0.034 | 0.902 |
| BaP | BaP | -0.062 | 0.836 |
| exponential_vs_stationary_24highlight | exponential_vs_stationary_24highlight | -0.267 | 0.0233 |
| co2_elevated_stat_arrays | co2_elevated_stat_arrays | 0.205 | 0.432 |
| lowtemp_TMEVA | lowtemp_TMEVA | 0.302 | 0.297 |
| highpH_TMEVA | highpH_TMEVA | 0.285 | 0.108 |
| co2_elevated_expo_arrays | co2_elevated_expo_arrays | 0.023 | 0.969 |
| lowFe_TMEVA | lowFe_TMEVA | 1.260 | 0.00104 |
| exponential_vs_stationary_24light | exponential_vs_stationary_24light | -0.438 | 0.219 |
| lowN_TMEVA | lowN_TMEVA | 0.125 | 0.761 |
| diel_exponential_vs_stationary | diel_exponential_vs_stationary | -0.252 | 0.233 |
| lowSi_TMEVA | lowSi_TMEVA | 0.984 | 0.0232 |
| highlight_arrays | highlight_arrays | 0.483 | 0.00548 |


