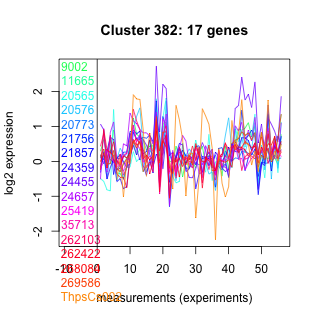
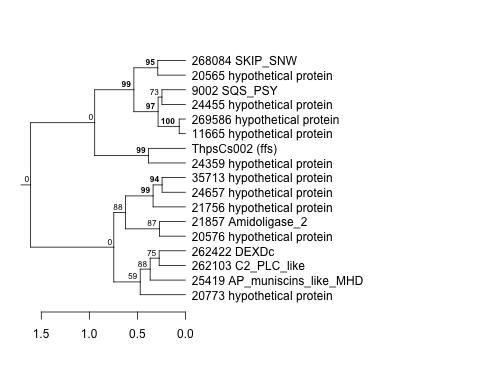
Thaps_hclust_0382 Hierarchical Clustering
Thalassiosira pseudonana
| Cluster Plot | Conditions Plot | Dendrogram |
|---|---|---|
 |
 |
 |
| GO ID | Go Term | p-value | q-value | Cluster |
|---|---|---|---|---|
| GO:0006629 | lipid metabolism | 0.0354559 | 1 | Thaps_hclust_0382 |
| GO:0007165 | signal transduction | 0.0486276 | 1 | Thaps_hclust_0382 |
| GO:0007242 | intracellular signaling cascade | 0.0510063 | 1 | Thaps_hclust_0382 |
| GO:0006464 | protein modification | 0.0710257 | 1 | Thaps_hclust_0382 |
| GO:0006508 | proteolysis and peptidolysis | 0.308243 | 1 | Thaps_hclust_0382 |
| GO:0006355 | regulation of transcription, DNA-dependent | 0.325408 | 1 | Thaps_hclust_0382 |
|
9002 : SQS_PSY |
21756 : hypothetical protein |
24657 : hypothetical protein |
262422 : DEXDc |
|
11665 : hypothetical protein |
21857 : Amidoligase_2 |
25419 : AP_muniscins_like_MHD |
268084 : SKIP_SNW |
|
20565 : hypothetical protein |
24359 : hypothetical protein |
35713 : hypothetical protein |
269586 : hypothetical protein |
|
20576 : hypothetical protein |
24455 : hypothetical protein |
262103 : C2_PLC_like |
ThpsCs002 : (ffs) |
|
20773 : hypothetical protein |
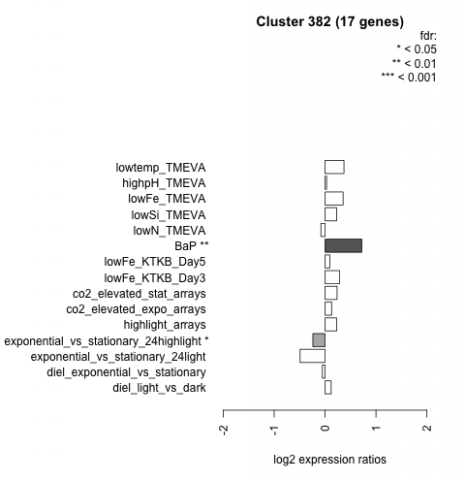
| Condition | Condition | Difference | FDR |
|---|---|---|---|
| diel_light_vs_dark | diel_light_vs_dark | 0.119 | 0.679 |
| lowFe_KTKB_Day3 | lowFe_KTKB_Day3 | 0.286 | 0.276 |
| lowFe_KTKB_Day5 | lowFe_KTKB_Day5 | 0.095 | 0.689 |
| BaP | BaP | 0.721 | 0.00162 |
| exponential_vs_stationary_24highlight | exponential_vs_stationary_24highlight | -0.240 | 0.0341 |
| co2_elevated_stat_arrays | co2_elevated_stat_arrays | 0.235 | 0.345 |
| lowtemp_TMEVA | lowtemp_TMEVA | 0.372 | 0.184 |
| highpH_TMEVA | highpH_TMEVA | 0.031 | 0.901 |
| co2_elevated_expo_arrays | co2_elevated_expo_arrays | 0.130 | 0.574 |
| lowFe_TMEVA | lowFe_TMEVA | 0.355 | 0.223 |
| exponential_vs_stationary_24light | exponential_vs_stationary_24light | -0.492 | 0.138 |
| lowN_TMEVA | lowN_TMEVA | -0.080 | 0.842 |
| diel_exponential_vs_stationary | diel_exponential_vs_stationary | -0.053 | 0.82 |
| lowSi_TMEVA | lowSi_TMEVA | 0.227 | 0.839 |
| highlight_arrays | highlight_arrays | 0.228 | 0.184 |