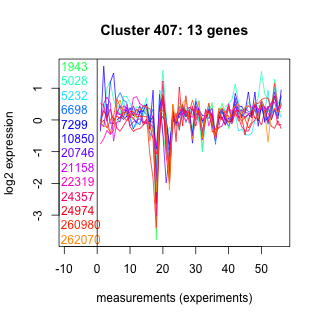
Thaps_hclust_0407 Hierarchical Clustering
Thalassiosira pseudonana
| Cluster Plot | Conditions Plot | Dendrogram |
|---|---|---|
 |
 |
 |
| GO ID | Go Term | p-value | q-value | Cluster |
|---|---|---|---|---|
| GO:0006915 | apoptosis | 0.00412967 | 1 | Thaps_hclust_0407 |
| GO:0007018 | microtubule-based movement | 0.0436835 | 1 | Thaps_hclust_0407 |
| GO:0006508 | proteolysis and peptidolysis | 0.264399 | 1 | Thaps_hclust_0407 |
| GO:0006355 | regulation of transcription, DNA-dependent | 0.27964 | 1 | Thaps_hclust_0407 |
| GO:0008152 | metabolism | 0.355748 | 1 | Thaps_hclust_0407 |
|
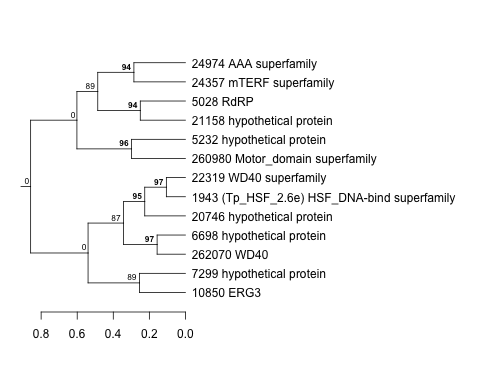
1943 : (Tp_HSF_2.6e) HSF_DNA-bind superfamily |
7299 : hypothetical protein |
21158 : hypothetical protein |
24974 : AAA superfamily |
|
5028 : RdRP |
10850 : ERG3 |
22319 : WD40 superfamily |
260980 : Motor_domain superfamily |
|
5232 : hypothetical protein |
20746 : hypothetical protein |
24357 : mTERF superfamily |
262070 : WD40 |
|
6698 : hypothetical protein |
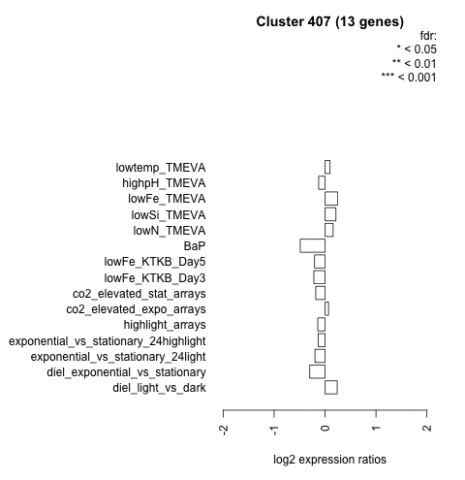
| Condition | Condition | Difference | FDR |
|---|---|---|---|
| diel_light_vs_dark | diel_light_vs_dark | 0.239 | 0.385 |
| lowFe_KTKB_Day3 | lowFe_KTKB_Day3 | -0.220 | 0.478 |
| lowFe_KTKB_Day5 | lowFe_KTKB_Day5 | -0.207 | 0.42 |
| BaP | BaP | -0.487 | 0.0558 |
| exponential_vs_stationary_24highlight | exponential_vs_stationary_24highlight | -0.134 | 0.329 |
| co2_elevated_stat_arrays | co2_elevated_stat_arrays | -0.183 | 0.503 |
| lowtemp_TMEVA | lowtemp_TMEVA | 0.097 | 0.786 |
| highpH_TMEVA | highpH_TMEVA | -0.126 | 0.551 |
| co2_elevated_expo_arrays | co2_elevated_expo_arrays | 0.069 | 0.873 |
| lowFe_TMEVA | lowFe_TMEVA | 0.249 | 0.432 |
| exponential_vs_stationary_24light | exponential_vs_stationary_24light | -0.198 | 0.657 |
| lowN_TMEVA | lowN_TMEVA | 0.157 | 0.708 |
| diel_exponential_vs_stationary | diel_exponential_vs_stationary | -0.302 | 0.175 |
| lowSi_TMEVA | lowSi_TMEVA | 0.212 | 0.854 |
| highlight_arrays | highlight_arrays | -0.143 | 0.489 |